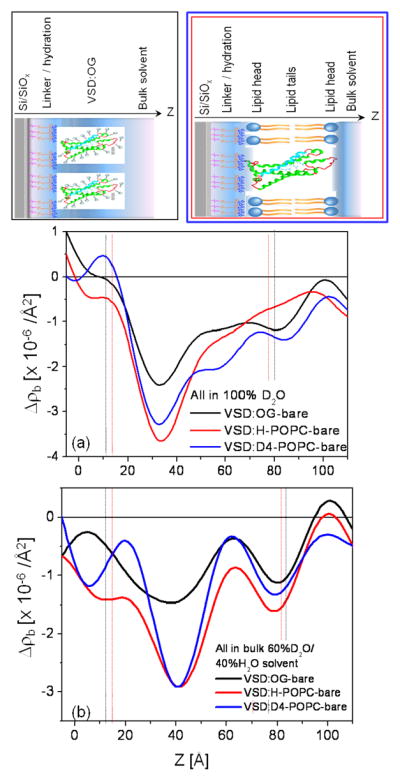
Figure 6.

Summary of the neutron interferometry results at the solid/liquid interface in terms of the difference (not offset) scattering-length density profiles Δρb(z) for the tethered VSD:OG monolayer and the reconstituted tethered VSD:H-POPC and VSD:D4-POPC membranes in (a) aqueous buffer with 100% D2O and (b) aqueous buffer with 60% D2O/40% H2O. (top) Schematic illustrations of the composite structures showing different components with respect to bilayer normal (z) approximately to scale. The VSD protein (green-turquoise ribbon-representation), OG detergent (gray), POPC lipid (blue-orange) and bulk water (light-blue) are shown. The dotted vertical lines shown to visually guide compartmentalization of the different component(s)—see text. Note that the zero-level of scattering-length density on the ordinate-scale in these difference profiles is with respect to the average for bulk D2O at +6.36×10⁻⁶/Å2 for 100% D2O in (a) and for bulk 60% D2O/40% H2O at +3.56×10⁻⁶/Å2 in (b).
