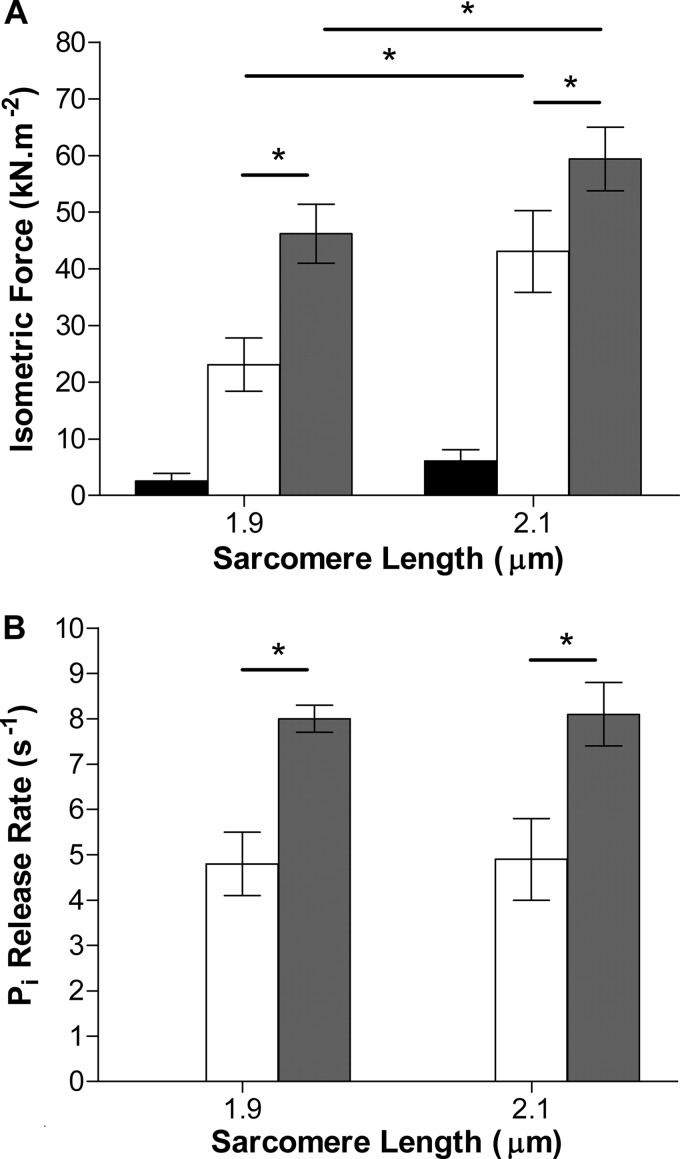
FIGURE 5.
Effect of SL and activation level on isometric force and Pi release rate. Data from Fig. 4 shown in the form of a bar graph, for isometric force (A) and the rate constant for Pi release (B) at 1 μmol/liter of Ca2+ (white bars) and 32 μmol/liter of Ca2+ (gray bars). BDM (10 mmol/liter) was used to abolish force development and Pi release due to cross-bridge cycling (black bars). Sarcomere length in the range 1.9 to 2.1 μm does not affect force or Pi release, but Ca2+ concentration does. Both parameters are approximately halved at 1 compared with 32 μmol/liter of Ca2+. Error bars indicate 1 S.E. ± mean for the number of experiments indicated in the text. *, p < 0.05.

