FIGURE 3.
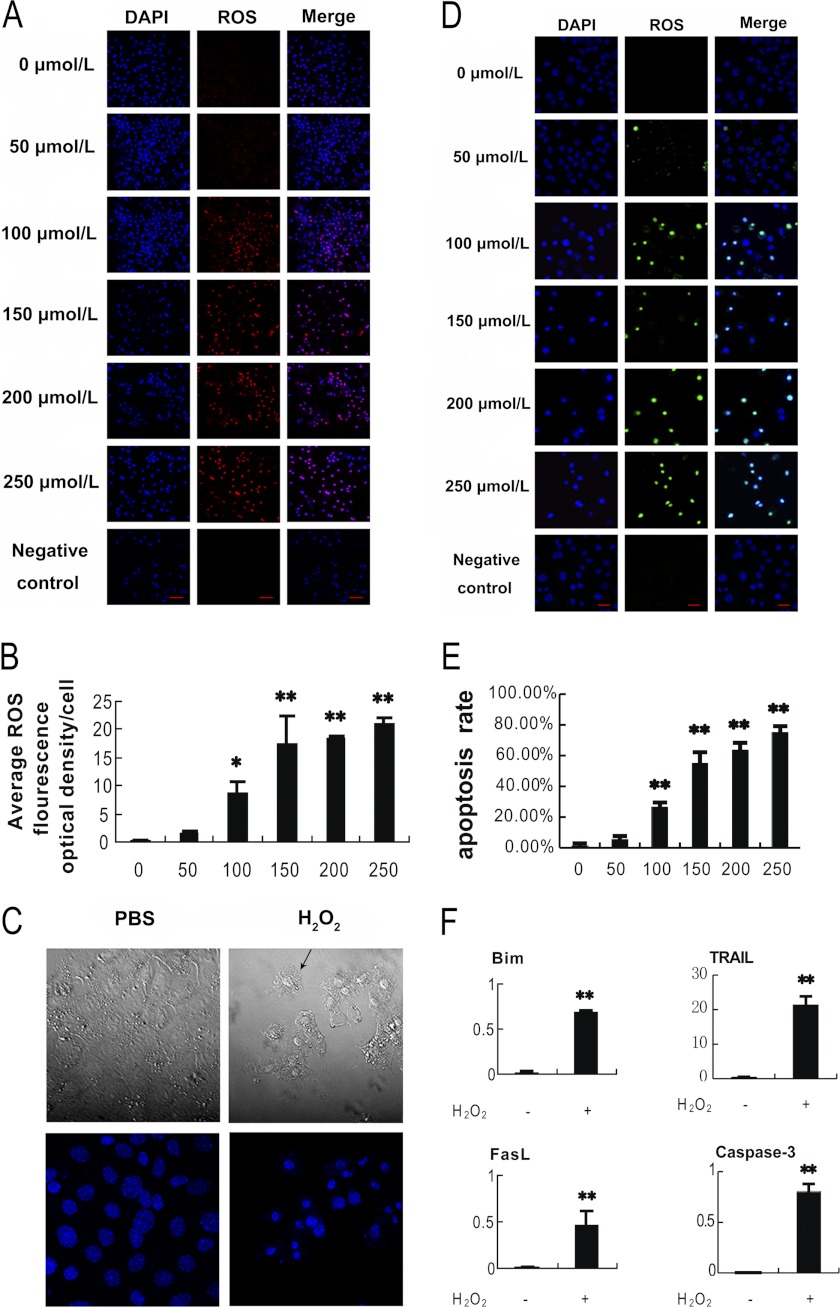
Oxidative stress-induced apoptosis in cultured MGCs. MGCs were treated with H2O2 at different concentrations as indicated for 24 h before harvested for tests. A, intracellular ROS were accumulated in a H2O2 dose-dependent manner. The ROS levels were detected by dihydroethidium bromide fluorescence (red), and nuclei were counterstained with DAPI (blue). B, quantification of intracellular ROS levels. ImageJ software was employed to analyze the optical density in each cell represented in A. C, H2O2 treatment induced apoptosis in MGCs. MGCs treated with or without H2O2 for 24 h were observed using laser confocal-scanning microscopy. Bottom, nuclei were stained with DAPI (blue). Magnification was ×400. D, apoptosis increased in a H2O2 dose-dependent manner in MGCs. Apoptosis was detected by TUNEL staining (FITC labeling). TUNEL-positive cells were displayed in green staining in the nuclei, which merged with the DAPI counterstaining (blue). Bar, 20 μm. E, quantification of the apoptosis rates (average number of TUNEL-positive staining nuclei per visual field). Experiments were repeated in triplicate, and three fields of each coverslip were selected in random for counting. Data represent mean ± S.E. (error bars) (n = 3). F, H2O2 promotes the expression of apoptosis relative genes. qRT-PCR was applied to detect the relative expression of these genes. The relative expression data were normalized to the amount of cellular β-actin. Data represent mean ± S.E. (n = 3). The statistical significance between groups was analyzed by one-way ANOVA. *, p < 0.05; **, p < 0.01.

