FIGURE 4.
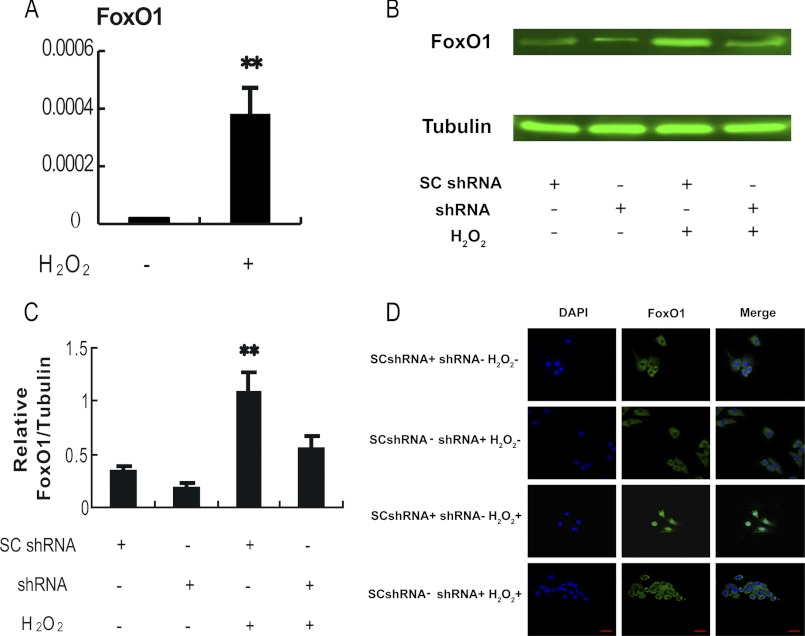
Oxidative stress-dependent induction of FoxO1 in the cultured MGCs. Primary MGCs were transfected with FoxO1 shRNA or control scramble shRNA (Fig. 6) for 24 h and exposed to 100 μm H2O2 for another 24 h before the cells were collected for tests. A, H2O2 treatment elevated FoxO1 mRNA expression in the cultured MGCs. Quantitative RT-PCR was employed to detect the relative expression of FoxO1. The expression data were normalized to the amount of cellular β-actin. B, H2O2 enhanced FoxO1 protein level in MGCs. Whole cell lysates were harvested from different treatment groups as indicated, and immunoblotting was performed to detect FoxO1 expression. α-Tubulin served as an internal control. C, quantification of relative FoxO1 protein level by gradation analyses. ImageJ software was applied to analyze the gradation of each band represented in Fig. 4B, and the relative expression level was normalized to the expression amount of α-tubulin. D, subcellular localization of FoxO1 in response to oxidative stress. Immunofluorescence of MGCs was imaged using anti-FoxO1 (green), and the nuclei were counterstained with DAPI (blue) (bar, 20 μm). The corresponding data above are represented as mean ± S.E. (error bars) (n = 3). The statistical significance between groups was analyzed by one-way ANOVA. *, p < 0.05; **, p < 0.01.

