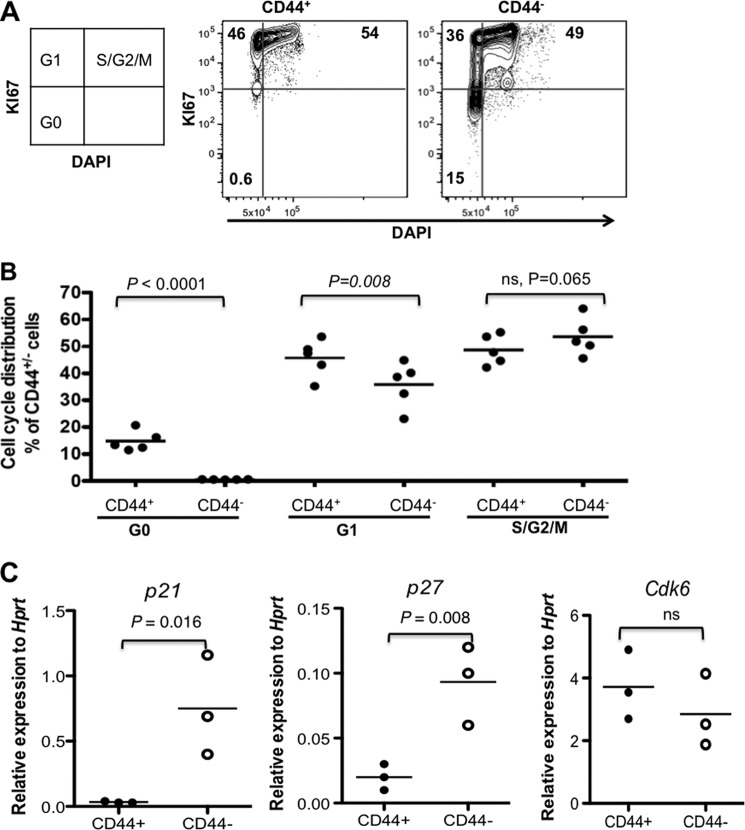
FIGURE 2.
Quiescent mesenchymal cells reside in the CD44− stromal cell fraction. A, one representative FACS profile of cell cycle analysis of the CD45−LIN−CD44+ and CD44− cells by KI67 and DNA staining. Cell cycle status within the defined CD45−LIN−CD44+ and CD44− cells was determined by simultaneous two-parameter analysis with DNA content versus KI67 expression. Numbers in quadrants show the percentages of the gated CD44+ and CD44− cells in each of the cell cycle phases (G0, G1, and S/G2/M). B, mean cell cycle distribution of total CD44+ and CD44− cells. Data are from two experiments. C, Q-PCR analysis of cell cycle regulator genes p21, p27, and Cdk6 in the CD44+ and CD44− cells. The data were normalized to endogenous Hprt expression, from two independent sorting experiments. Each dot represents the mean of triplicate measurements for each gene. The differences between the two cell populations are indicated in the panels.

