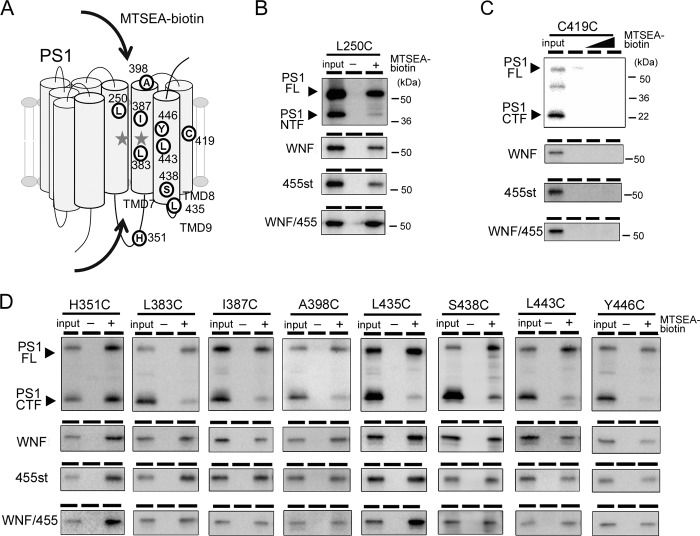
FIGURE 3.
SCAM analysis of PS1 mutants. A, schematic representation of residues in PS1 analyzed in this study. The letters in white circles indicate the residues that are substituted to cysteine. Gray stars denote the catalytic center aspartates. In this preparation, MTSEA-biotin had access to Cys residues from both the extracellular and the intracellular sides (arrows). B–D, SCAM analysis of PS1 mts carrying Cys substitutions at NTF (B) or CTF (C and D). Minus and Plus denote samples incubated without or with MTSEA-biotin, respectively. Final concentration of MTSEA-biotin was 6.6 μm for L250C and S438C and 3.3 μm for other Cys mutants. Biotinylated proteins were precipitated by streptavidin beads, and the entire eluate was analyzed by immunoblotting. The loaded amount of input was 6.5% relative to labeled fraction. C, labeling to C419C mt by MTSEA-biotin at 0, 10, and 100 μm as denoted above the lanes. PS1 was detected by immunoblotting using PS1NT (anti-PS1 NTF) (B) and G1L3 (anti-PS1 CTF) (C and D). FL, full-length.

