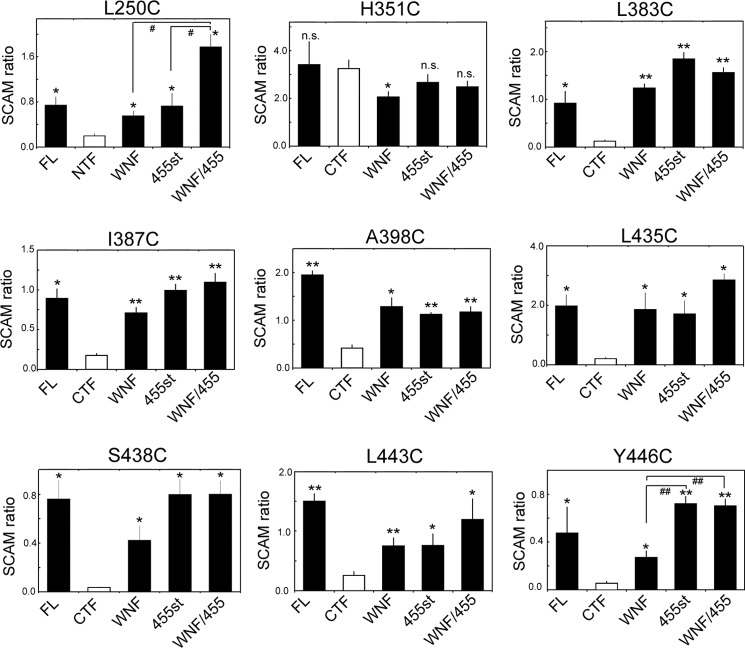
FIGURE 4.
Quantification of SCAM analysis on PS1 mutants. Quantification of SCAM ratio by densitometric analysis of each band as shown in Fig. 3 was performed. SCAM ratio was calculated as the ratio of each PS1 polypeptide in MTSEA-biotin (+) to that in the input. *, p < 0.05; **, p < 0.01 (Student's t test, n = 3–8, mean ± S.E. when compared with that of NTF or CTF (white bar)); #, p < 0.05; ##, p < 0.01 (Student's t test, n = 3–8, mean ± S.E., sample pairs indicated by lines). FL, full-length; n.s., not significant.

