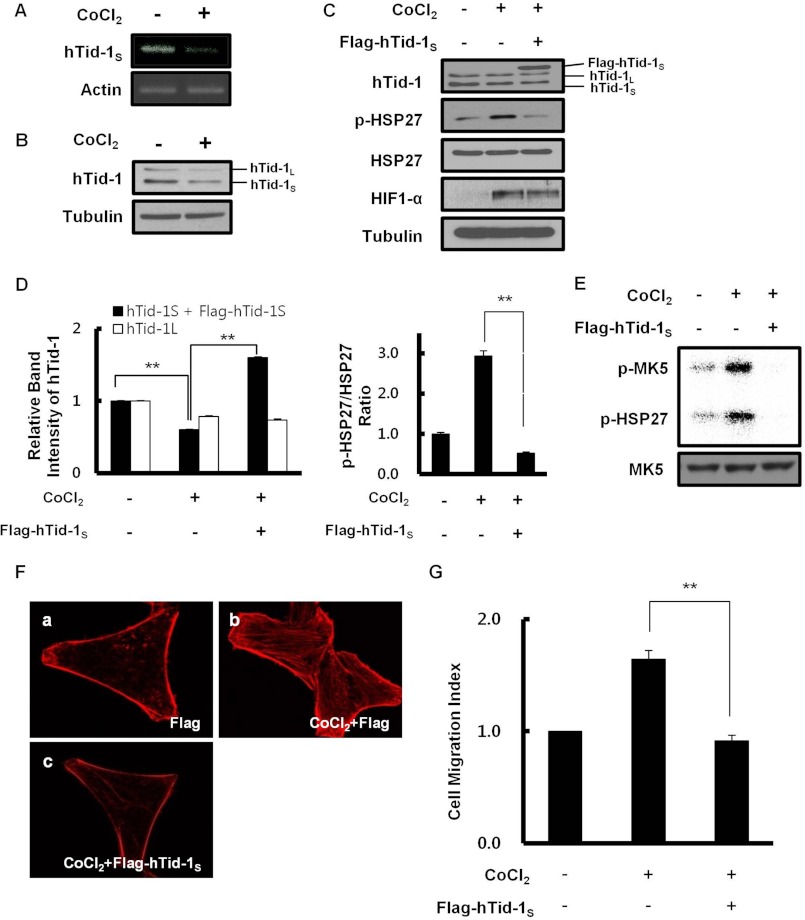
FIGURE 3.
Down-regulation of hTid-1S expression under hypoxic conditions enhances actin cytoskeleton organization. A, HeLa cells (2 × 10⁶) were treated with 200 μm CoCl2 for 24 h. Reverse transcription-PCR analysis was carried out using specific primer for hTid-1S (forward, 5′-TCAGGGTGCAGAAAAGCCCT-3′; reverse, 5′-CTAGTTTCCAGTGGATCTTTTTC-3′). β-Actin served as a loading control. B, intracellular level of hTid-1S or hTid-1L was examined by immunoblotting using anti-hTid-1 antibody. Tubulin was used as a loading control. C, HeLa cells (2 × 10⁶) were transiently transfected with expression vector for FLAG-hTid-1S (2 μg). After incubation for 24 h, transfected cells were treated with 200 μm CoCl2 for 24 h. Cellular level of endogenous HSP27, phosphorylated HSP27, hTid-1, HIF1-α, or tubulin was examined by immunoblot analysis. D, relative band intensities in Western blot were quantified, and the pHSP27/HSP27 ratio in HeLa cells is presented. The band intensity of hTid-1S plus FLAG-hTid-1S or hTid-1L in untreated cells was, respectively, set to 1.0 (left). The pHSP27/HSP27 ratio of untreated cells was set to 1.0 (right). Data represent mean ± S.D. (error bars; n ≥ 3 experiments). **, p < 0.01. E, HeLa cells (∼107) were left untreated or treated with 200 μm CoCl2 for 24 h. Cell lysate proteins were immunoprecipitated using anti-MK5 antibody. MK5 kinase activity was determined by measuring the transfer of 32P-labeled phosphate moiety from [γ-32P]ATP to MK5 and HSP27. Activation phosphorylation of MK5 or HSP27 phosphorylation was visualized by autoradiography (upper). Cellular level of MK5 present in total cell lysates was examined by immunoblot analysis using anti-MK5 antibody (lower). F, effect of hTid-1S expression on hypoxia-induced actin cytoskeleton organization was evaluated. a and b, HeLa cells (5 × 10⁵) were left untreated (a) or treated with 200 μm CoCl2 for 24 h (b). c, HeLa cells (5 × 10⁵) were transfected with expression vector for FLAG-hTid-1S (1 μg). After incubation for 24 h, cells were treated with 200 μm CoCl2 for 24 h. F-actin was visualized after staining cells with rhodamine-conjugated phalloidin. G, effect of hTid-1S expression on hypoxia-induced cell migration is shown. HeLa cells were transfected with expression vector for hTid-1S. After incubation for 24 h, control or transfected HeLa cells were treated with 200 μm CoCl2 for 24 h. Cell migration was expressed as a Migration Index as in Fig. 2B. Data represent mean ± S.D. (error bars; n ≥ 3 experiments). **, p < 0.01.

