FIGURE 4.
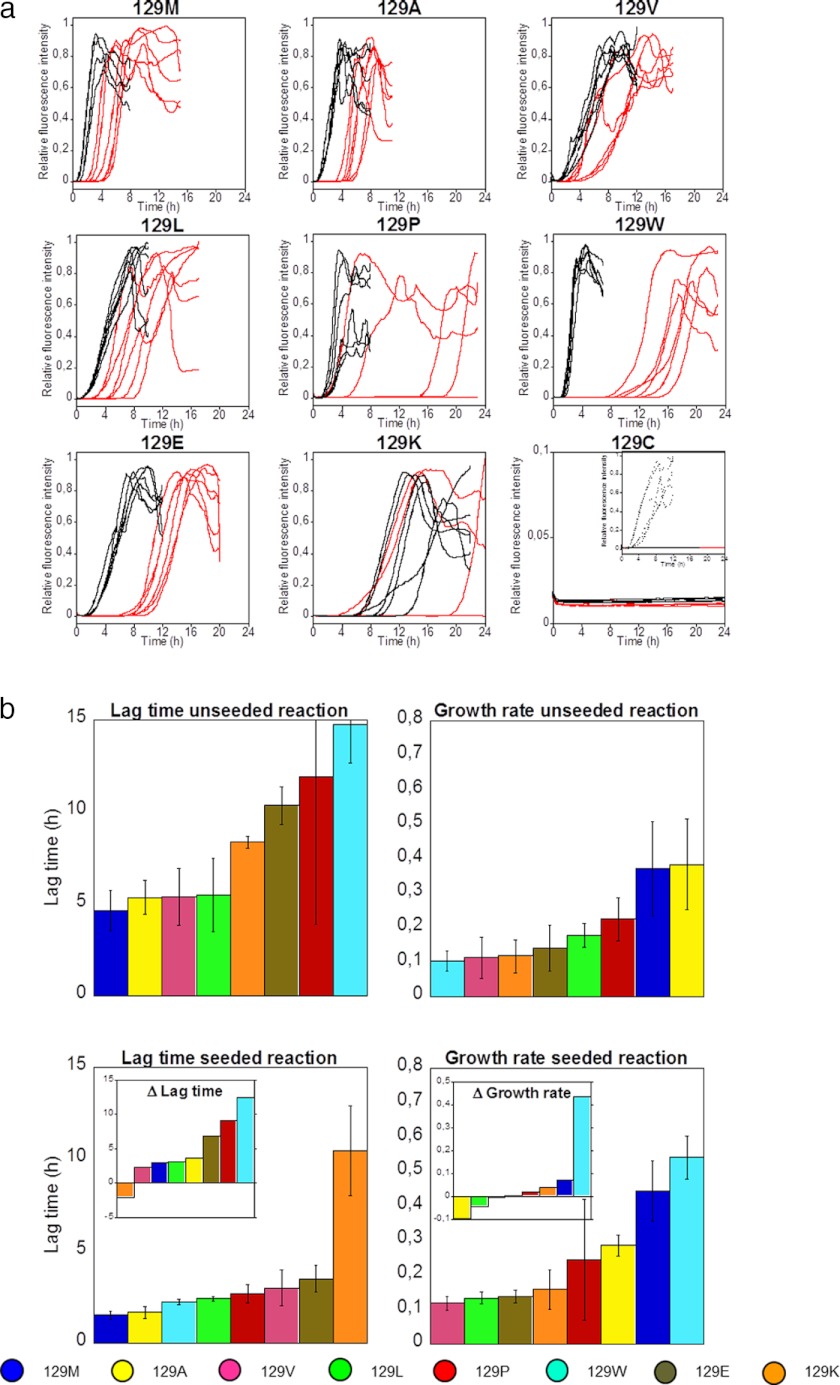
Amyloid fibril formation kinetics of HuPrP(90–231) mutants. a, normalized kinetic traces (ThT) of amyloid fibril reactions for all investigated mutants were monitored for 24 h in 96-well plates. Spontaneous reactions were displayed in red, and the reaction was seeded with 1% fibrils displayed in black. The kinetic traces of M129C have been related to the intensity of the wild type (129M) reaction (note the different y axis). The inset in the M129C graph shows the kinetics of M129C seeded with 1% wild type fibrils (n = 6 for each reaction). b, amyloid fibril formation kinetic parameters of HuPrP(90–231) variants in the absence and presence of 1% seed from Fig. 4a (data for 129C not shown). The top panels show lag times and growth rates of the spontaneous reactions, and the bottom panels show the same parameters for fibrillation reactions seeded with 1% fibrils from the same sequence. The average lag times and growth rates were calculated for samples that converted within 24 h. The color code for mutant identification is shown at the bottom of the figure. The insets in the bottom panels show the differences (Δ) of lag time and growth rates compared with spontaneous reactions.

