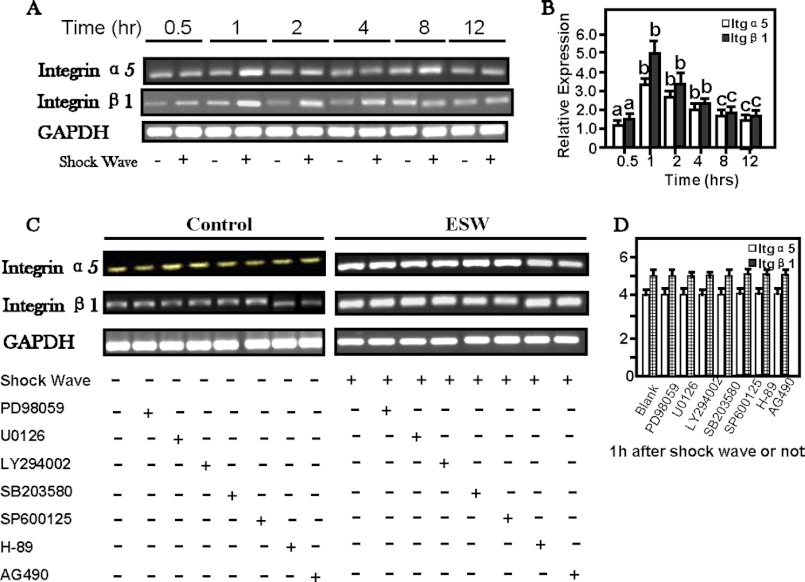
FIGURE 3.
A–D, ESW-induced elevations of mRNA level of α5 and β1 integrin of osteoblasts, peaking at 1 h (B). The specific inhibitors for signal transduction pathways had no influence on the integrin expression (C). A and C, representative electrophoretic images. The osteoblasts were harvested to extract total RNA 0.5, 1, 2, 4, 8, and 12 h after 500 impulses of 10-kV shock wave treatment. The cells without ESWT were run as control groups. After standardization of housekeeping gene expression, equal amounts of cDNA from each sample were subjected to 36 cycles to amplify Itga5 and Itgb1 mRNA expression. The values of the control group were normalized to 100%. a, p > 0.05; b, p < 0.01; c, p < 0.05 as compared with the control group at certain time periods. In addition, several signal transduction pathway inhibitors were added to the samples for 1 h prior to ESWT. 2 h after ESWT, the samples were collected to extract RNA and to analyze whether the Itga5 and Itgb1 mRNA were influenced by signal pathway inhibitors listed above. Our data showed that no influence on the expression of Itga5 or Itgb1 mRNA was observed under the conditions with or without inhibitors (p > 0.05). Error bars, S.D.

