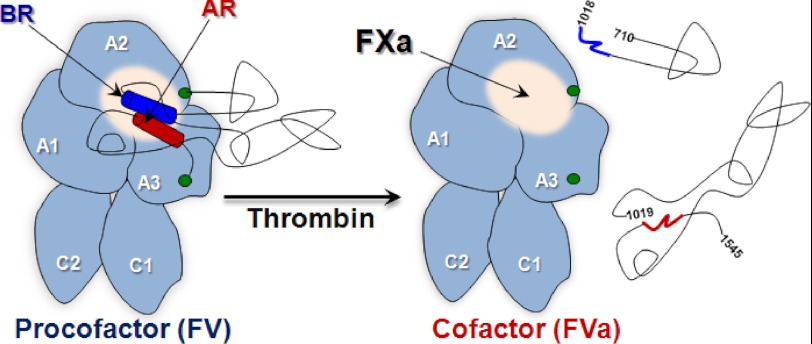
FIGURE 7.
Schematic of FV activation and functional landmarks. After thrombin processing to FVa, the B-domain (black lines) was released as two large fragments thereby exposing a FXa binding site. For FV, the BR (dark blue) and AR (dark red) are shown as cylinders; the putative FXa binding site is shown as a white sphere; green circles represent the end of the A2 and beginning of A3 domains.

