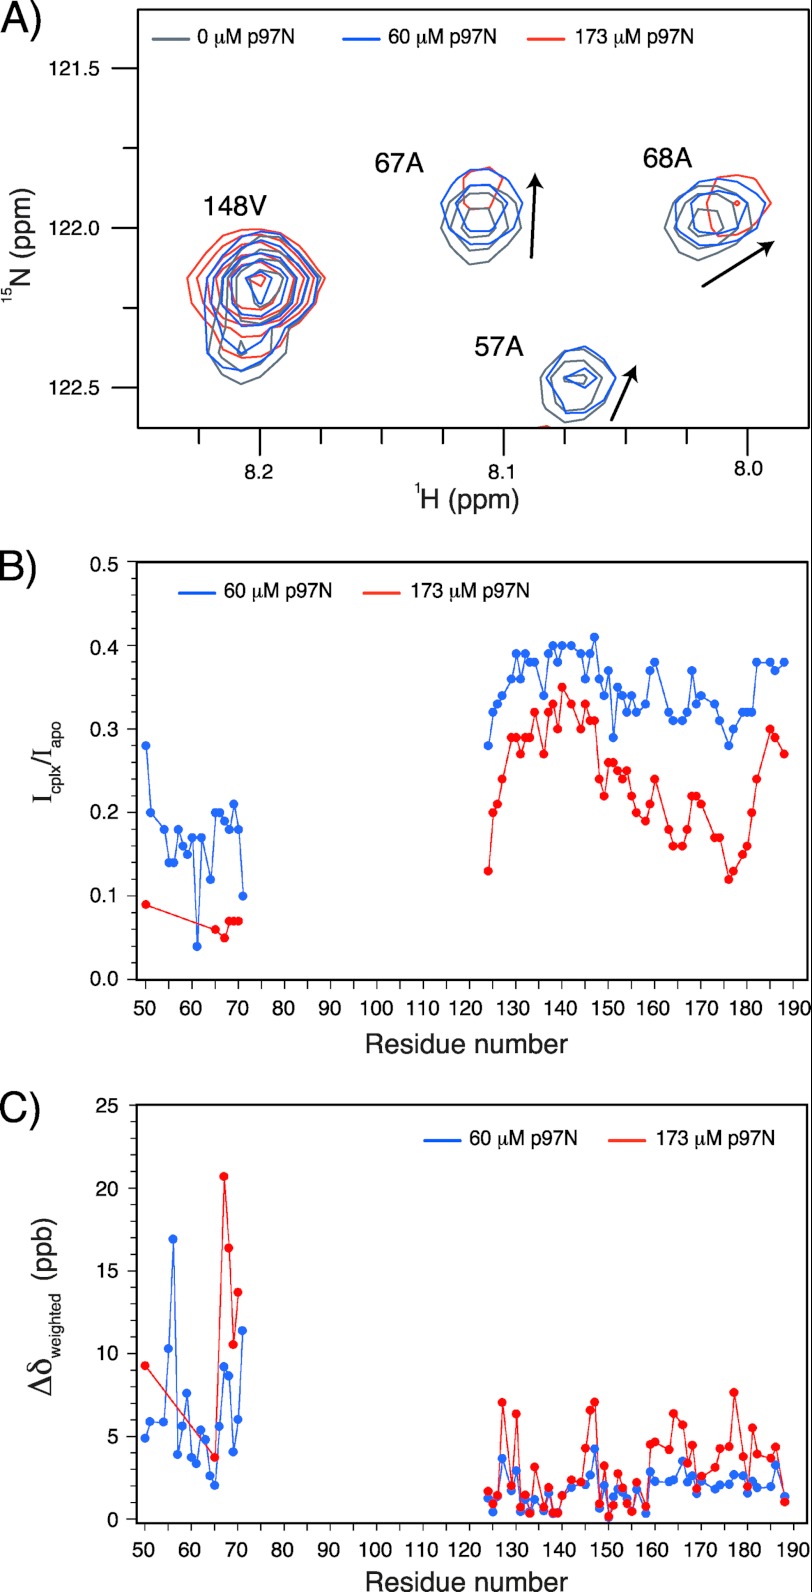
FIGURE 6.
cVIMP-Cys interacts with the N-domain of p97. A, HSQC spectra were recorded of 15N-cVIMP-Cys (50 μm) in the absence of p97N, and in the presence of 60 μm and 173 μm p97N. Four selected peaks from the HSQC spectra are shown as an overlay of 50 μm 15N-cVIMP-Cys (gray), 50 μm 15N-cVIMP-Cys with 60 μm p97N (blue, 4-fold decrease in the base contour level), and 50 μm 15N-cVIMP-Cys with 173 μm p97N (red, 8-fold decrease in the base contour level). The plotting at different contour levels of the spectra is necessary to see peaks in all three spectra. Arrows indicate the direction of the chemical shift change. B, plot of intensity ratio (Icplx/Iapo) as a function of residue number. Icplx denotes the intensity of peaks in the sample with either 60 μm p97N (blue) or 173 μm (red) p97N, and Iapo refers to the intensity of peaks in the sample without p97N. C, change in peak positions reported as the weighted chemical shift difference induced by addition of p97N (Δδweighted) is plotted as a function of residue number for peaks in the samples with 60 μm p97N (blue) and 173 μm p97N (red). Δδweighted is given in parts per billion (ppb). Peaks that were poorly defined or completely absent are not included in the plots in panels B and C (thus the lack of data points for e.g. most of residues 50–71 in the sample with 173 μm p97N). Signals for residues 72–123 were not observed even in the absence of p97N (see text for details).

