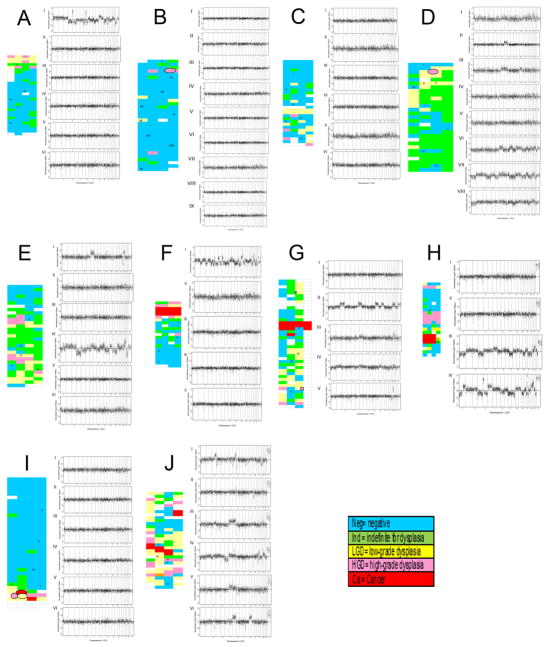
Figure 1. Instability along the colon of UC progressor patients.
Shown are whole genome plots illustrating the copy number instability in biopsies sampled taken along the colons of ten UC progressor patients (A–J). Left, maps of the respective colons showing relative spatial locations and histological diagnoses. Blue, negative for dysplasia; green, indefinite for dysplasia; yellow, low grade dysplasia; pink, high grade dysplasia; red, cancer; blank, no histological diagnosis available. Right, whole genome plots showing normalized log2 ratios for chromosomes 1–22 and X (ordered from left to right). Roman numerals correspond to the biopsy position on the respective colon maps. The horizontal line indicates log2 ratio of zero, or normal copy number of 2. Spots above the line indicate BACs with copy number gain; spots below the line indicate BACs with copy number loss.

