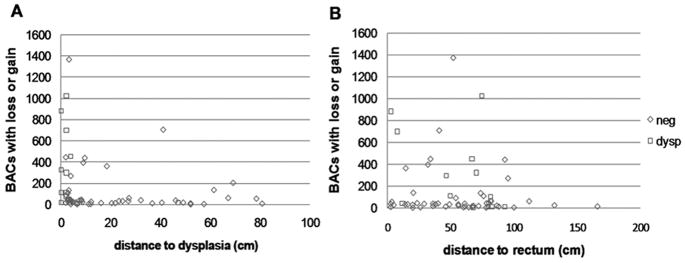
Figure 2. BAC alterations affected by distance to dysplasia but not distance to rectum.
Shown are scatterplots of number of BACs with copy number gain or loss as detected by wavelet. A, Alterations plotted as a function of distance to dysplasia (cm). B, Alterations plotted relative to distance to rectum (cm). Negative for dysplasia, open blue triangles; dysplasia, open red squares. This data suggests that a single non-dysplastic biopsy from the rectum could detect genomic instability.

