
Figure 4. MAD (median absolute deviation) values of global genomic instability increase with neoplastic progression.
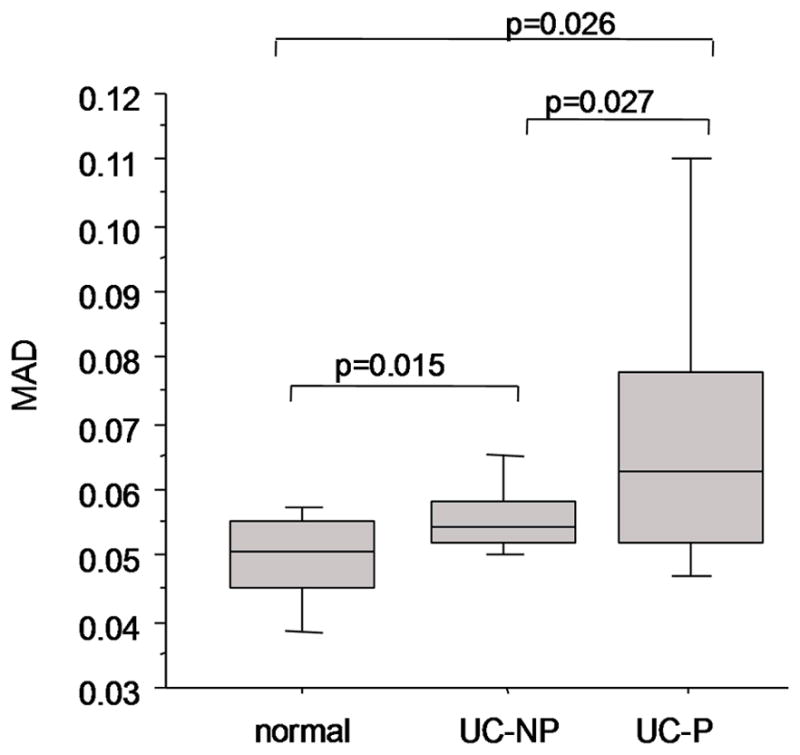
Shown are boxplots of the MAD values for the BAC arrays. The lines indicate the median values and the boxes denote the 75% and 25% for the arrays within each group. The error bars indicate the 90% and 10% for the arrays within each group. The MAD values for genomic instability sufficiently overlap between UC non-progressors (UC-NP) and UC progressors (UC-P), prevent the use of this measure as a clinically meaningful biomarker of neoplasia.