
Figure 2.
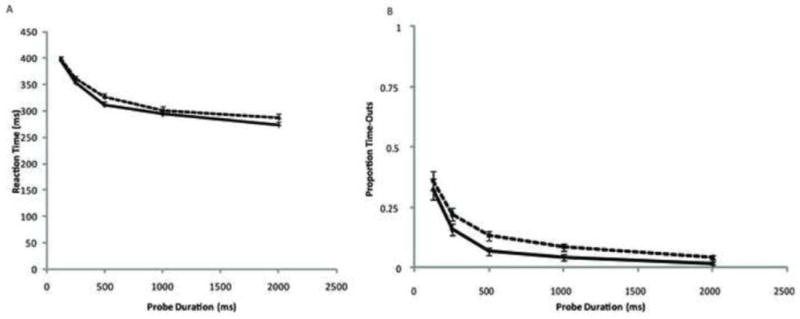
Data for reaction time and proportion of time-out trials as a function of probe duration. Data are shown for 26 young adults (solid lines) and 23 older adults (dotted lines). Error bars represent standard errors.
Official websites use .gov
A
.gov website belongs to an official
government organization in the United States.
Secure .gov websites use HTTPS
A lock (
) or https:// means you've safely
connected to the .gov website. Share sensitive
information only on official, secure websites.
Data for reaction time and proportion of time-out trials as a function of probe duration. Data are shown for 26 young adults (solid lines) and 23 older adults (dotted lines). Error bars represent standard errors.