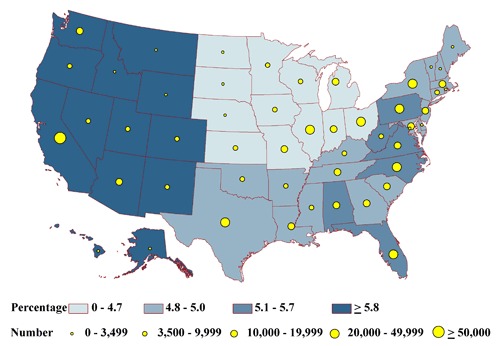
Figure 2e.

State-specific proportions and numbers of physically inactive diabetic adults aged 50 years or older who are otherwise healthy, 2000-2009 NHIS and 2000-2009 BRFSS. Proportions are classified by quartiles and numbers by the 5 groupings indicated. Healthy is defined as not meeting the criteria for homebound, frail, impaired, or having comorbid conditions.
