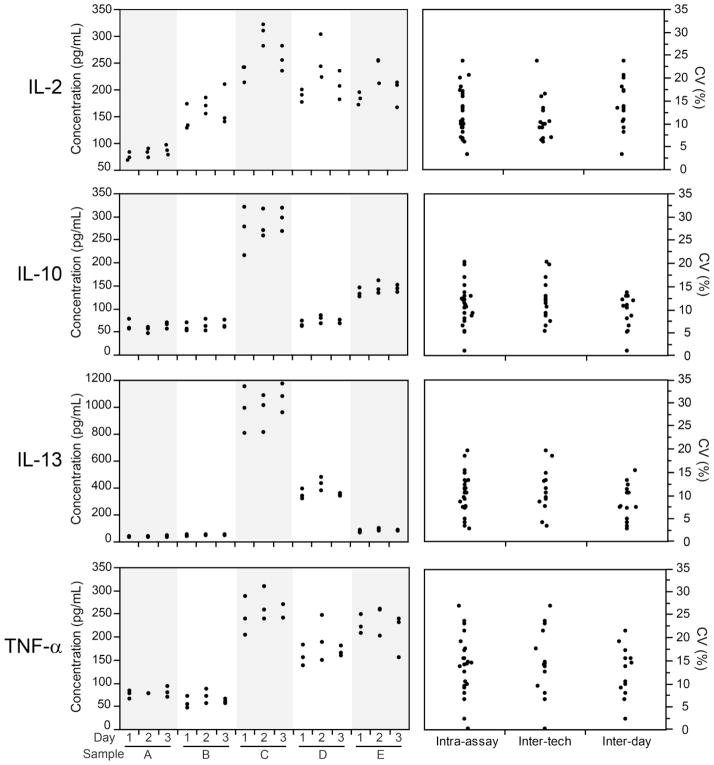
Figure 3. Intra-assay, inter-operator and inter-day variability.
Left graphs: IL-2, IL-10, IL-13 and TNF-α concentrations were measured by one technician in supernatants collected from CMV-stimulated PBMC from five donors (A–E) on three days (plated in triplicate). Right graphs: For each analyte, the coefficient of variation (CV) is summarized for each category of variability for all precision experiments. To determine inter-operator variability, three technicians measured analyte concentrations of the same samples on the same day. To determine inter-day variability, one technician examined analyte concentrations of the same supernatant samples on three days. Intra-assay refers to variability of the replicates.

