Figure 1.
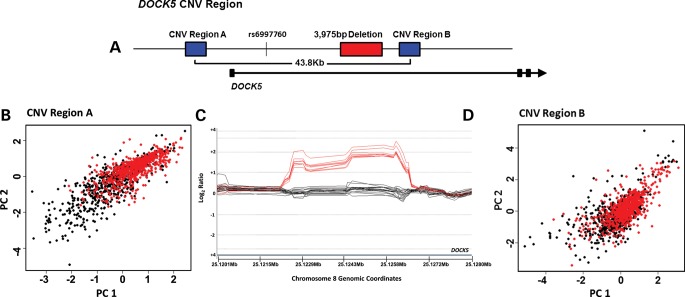
The DOCK5 region. (A) Schematic overview of the DOCK5 CNV region. Position of DOCK5 is shown by the black arrow, with exons shown as black boxes. The position of probe rs6997760 (chr8: 25 101 829) is indicated relative to VNTRs A and B and a 3975 bp deletion on chr8p21.2 in intron 1–2 of DOCK5. (B and D) Cluster plots of the first (x-axis) versus second (y-axis) principal components of the LRR across three and six intensity-only probes within each of VNTRs A and B, respectively. Probe positions located between chr8: 25 085 709–25 085 826 (VNTR A) and chr8: 25 129 632–25 130 278 (VNTR B). Red closed circles: obesity cases; black closed circles: normal-weight controls. (C) CGH analytics (Agilent Technologies) view of the 3975 bp CNV on chr8p21.2. Array CGH was carried out on 9 child obese cases, 10 adult obese cases and 9 child controls, using Agilent 8 × 15 k custom arrays. Log2 ratios are ∼0 for homozygous deleted samples, and ∼2 for heterozygous samples, as the reference sample appears to have a homozygous deletion at this locus. Samples homozygous for the deletion are shown in black, whereas samples with two copies are shown in red. Both the 3975 bp deletion and VNTR B lie within intron 1–2 of the DOCK5 gene (represented by the black arrow in A). Exons are represented as black boxes in (A).

