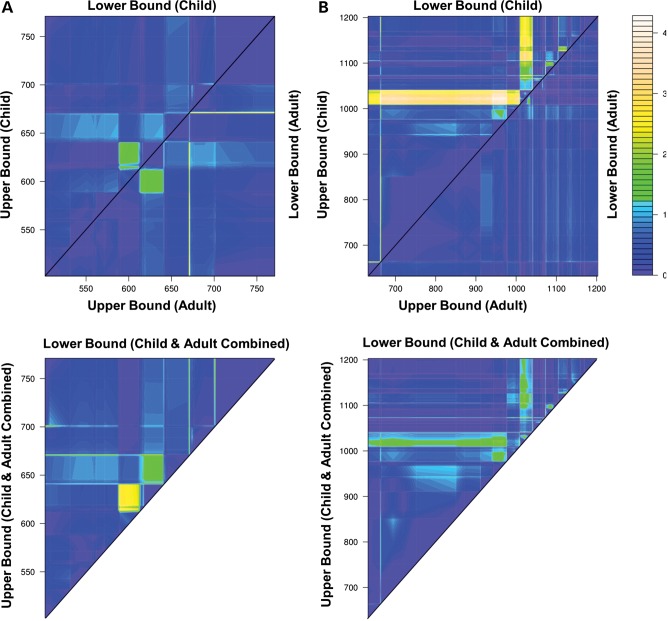
Figure 2.
Association of DOCK5 VNTR bins with obesity. The heat map indicates the level of association (−log10 P-value) between VNTR bins and obesity in a logistic regression model, after regressing out gender and the DOCK5 3795 bp deletion (see Materials and Methods). (A) VNTR A bins; (B) VNTR B bins. Top left triangle: association in child cohort; middle triangle: association in adult cohort; lower triangle: association in combined child and adult cohort.

