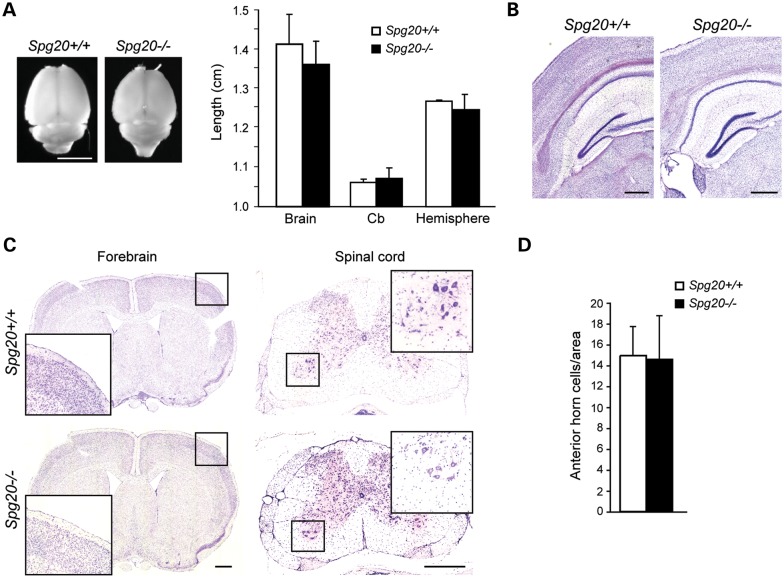
Figure 2.
Neuropathologic analysis of Spg20−/− mice. (A) Dorsal view of whole-mount adult brain (left) and measurements of whole-mount brain, cerebellum (Cb) and cerebral hemisphere length (right). Left and right sides of brain were measured as replicates, and average lengths were calculated. Means ± SD are graphed (n = 3 animals per genotype). Scale bar, 1 cm. (B) Nissl-stained parasagittal sections of brains from Spg20+/+ and Spg20−/− adult mice. Scale bar, 50 µm. (C) Left, parasagittal sections of mouse brains stained with H&E. Right, parasagittal sections of cervical spinal cord were stained with cresyl violet. Boxed regions are enlarged in the insets. Scale bar, 500 µm. (D) Relative number of spinal cord anterior horn cells was quantified per 0.6 cm2 area (means ± SD; n = 3).

