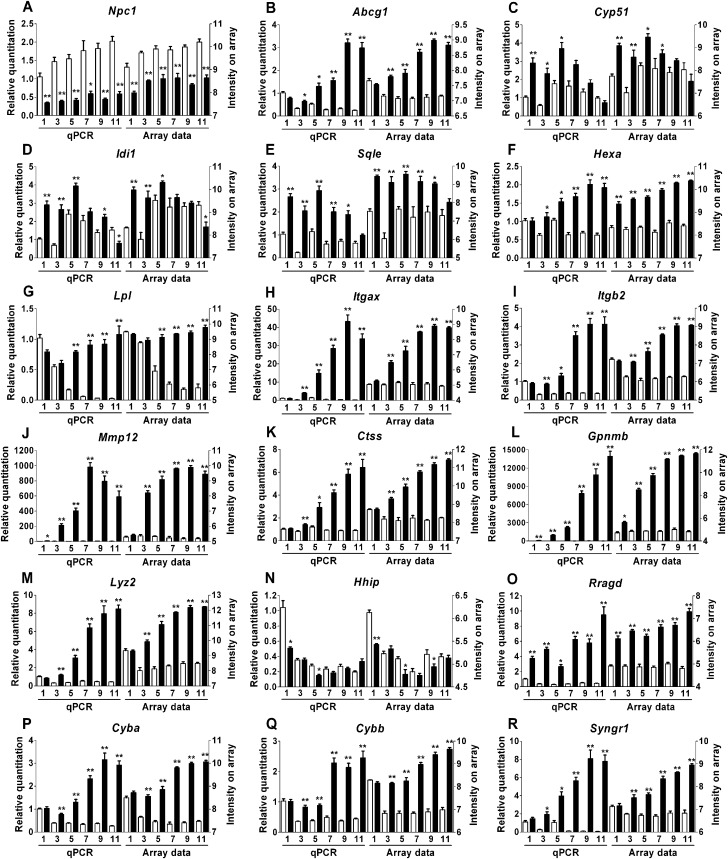
Figure 3.
Validation of expression array results. In order to validate the results obtained by array analysis, we used qPCR to determine the expression pattern of 18 genes in different functional categories at all six time points. Both the qPCR (left) and expression array (right) are shown for Npc1+/+ (white columns) and Npc1−/− (black columns). The mean and the standard error are shown for each group (n = 4). (A–E) Genes involved in cholesterol homeostasis. (F and G) Genes involved in lipid homeostasis. (H–J) Genes involved in cell adhesion and extracellular matrix remodeling. (K–M) Genes involved in immune response and inflammation. (N and O) Genes involved in developmental signaling. (P and Q) Genes involved in oxidative stress. (R) Gene involved in synaptic plasticity. To account for unequal variances in small-sample-size groups, an ANOVA test with a Games–Howell post hoc correction was performed to determine the significance of the difference in means between control and mutant mice at each age: *P-value ≤ 0.05; **P-value ≤ 0.001.

