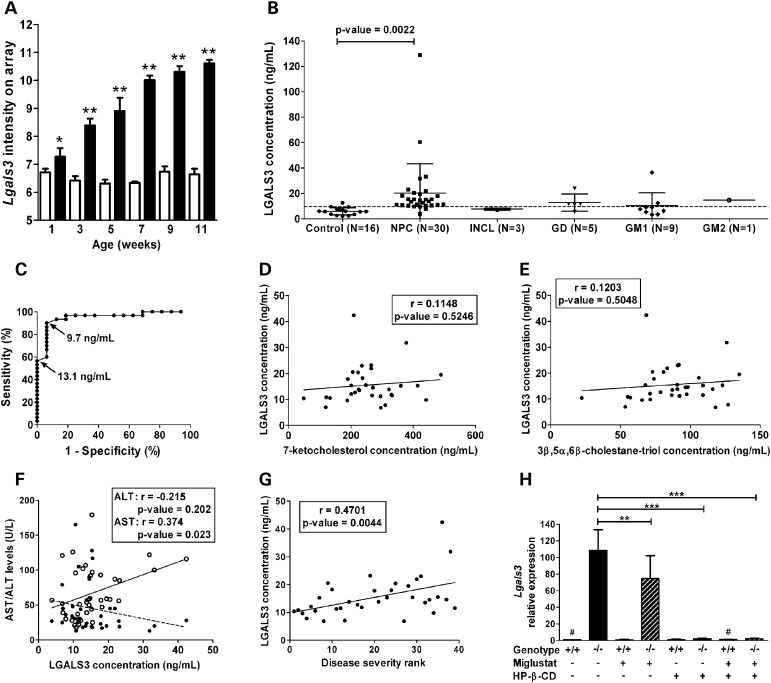
Figure 5.
LGALS3 as a potential biomarker in NPC1. (A) The microarray analysis showed that expression of Lgals3 was significantly increased in liver tissue from Npc1−/− (black columns) compared with Npc1+/+ (white columns), and that this dysregulated expression was progressive (mean and standard deviation, n = 4; *P-value ≤ 0.05; **P-value ≤ 0.0001). (B) The serum concentration of LGALS3 was increased in NPC1 subjects (n = 30) compared with age-appropriate controls (n = 16). In order to get an idea of potential specificity, we measured serum concentration of LGAL3 in subjects with four other lysosomal storage disorders (INCL, n = 3; GD, n = 5; GM-1 gangliosidosis, n = 9; and GM-2 gangliosidosis, n = 1). Mean and standard deviation are shown for each group. The dashed horizontal represents the 90% sensitivity cut-off (9.7 ng/ml) as determined by ROC analysis. (C) ROC analysis for LGALS3 (area under curve: 0.95; cut-off value of 13.1 ng/ml: specificity of 100%, sensitivity of 57%; cut-off value of 9.7 ng/ml: sensitivity increased to 90%, specificity of 94%). (D and E) LGALS3 levels did not correlate with serum levels of either 7-ketocholesterol (D) or 3β,5α,6β-cholestane-triol (E). (F) Correlation of LGALS3 with serum transaminase levels. (G) Serum LGALS3 levels showed a significant positive correlation (r = 0.47, P-value < 0.005) with increasing disease severity (severity rank from least to most severe cases, 1–39). (H) Effect of miglustat and HP-β-CD treatment on Lgals3 expression in the liver of Npc1 mice. Mice were chronically treated with either miglustat, HP-β-CD or a combination of both drugs from 1-week-old to their sacrifice at 9 weeks of age (see Materials and Methods for details). The mean and the standard deviation are shown for each group; n = 4 for all groups, except the two indicated with ‘#’ (n = 2). *P-value ≤ 0.05; **P-value ≤ 0.005; ***P-value ≤ 0.0001 (unpaired t-test).

