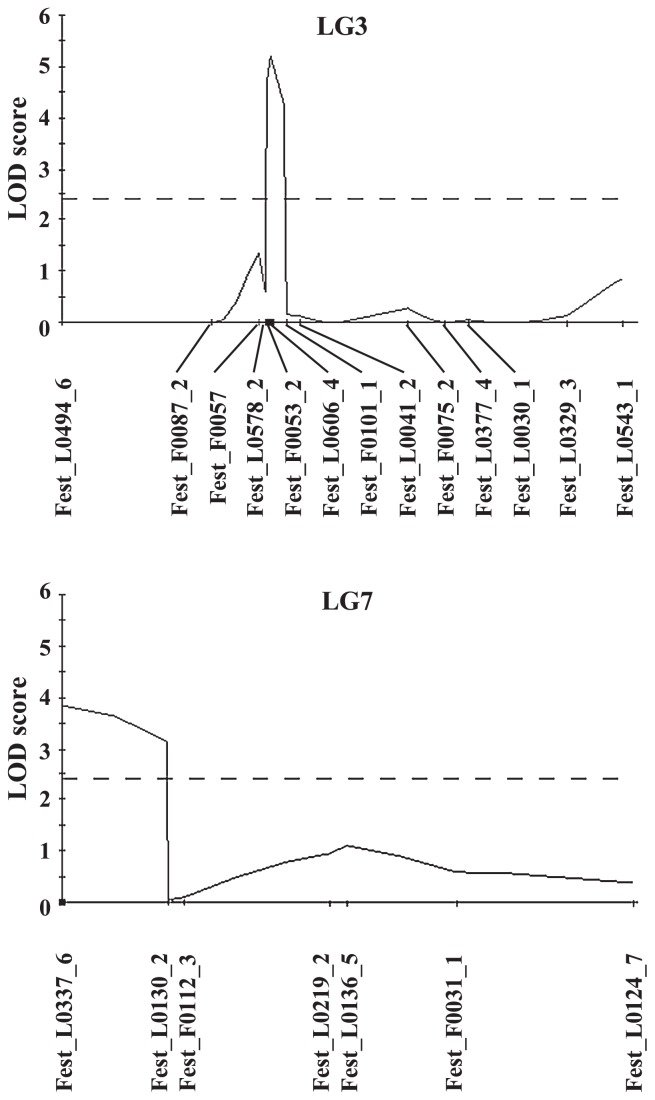
Fig. 4.
LOD score for QTLs detected in multiple QTL analysis. The QTL likelihood maps for each linkage group were obtained by using the MQM procedure of MapQTL, fixing one marker cofactor per putative QTL. Selected markers used as cofactors in analysis are indicated by black rectangles along the x-axes. The linkage group number is indicated at the top of each graph. Horizontal dashed lines indicate the 2.4 (P < 0.05) LOD score threshold.

