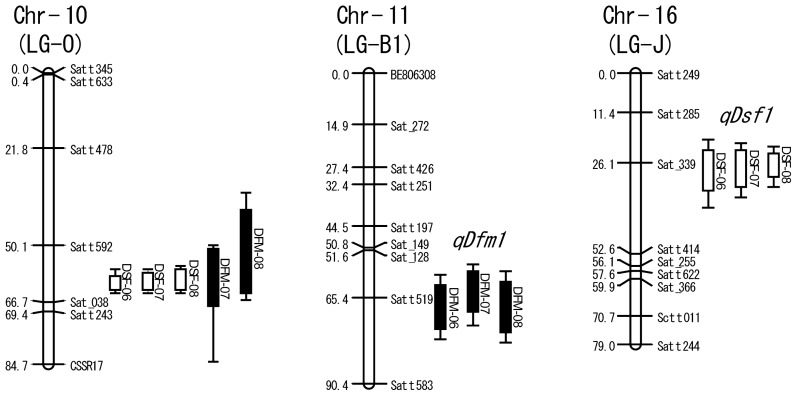
Fig. 2.
Locations of QTLs for DSF and DFM that were identified in at least two different years. QTLs for DSF and DFM are indicated by open bars and filled bars, respectively with lines at both ends. The bar and line indicate 1-logarithm of odds (LOD) and 2-LOD confidence interval (Ooijen 1992). Each marker name is shown on the right side of the linkage group, and cumulative map distance (in centi-Morgan) is shown on the left side. Three SSR loci, Sat_149, Sat_366 and Satt622 were reported by Song et al. (2004). The other loci were contained in the SSR panel of Sayama et al. (2011).

