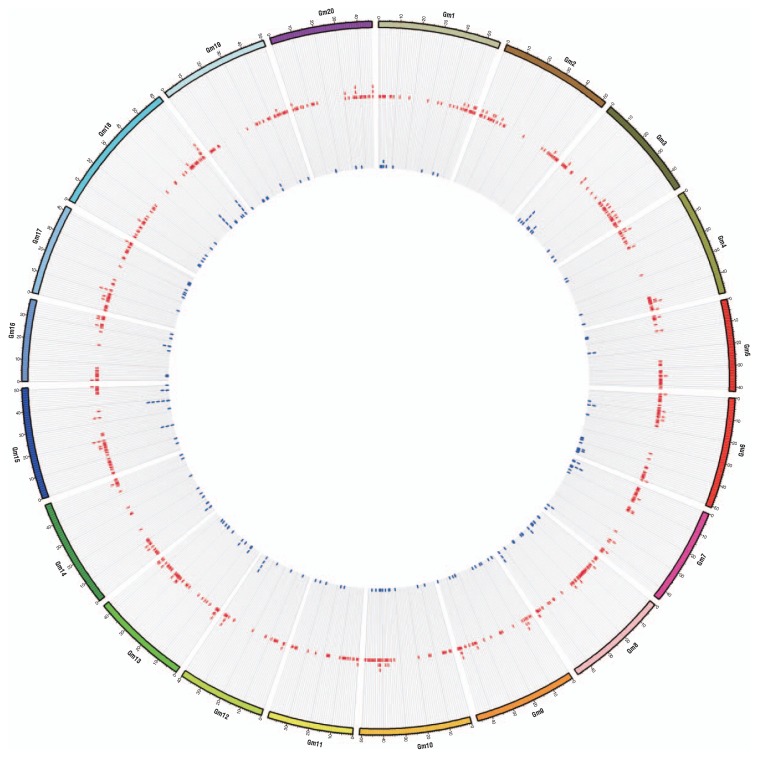
Fig. 1.
Chromosomal distribution of large deletion and inversion predicted by the mapping of G. soja genome sequences to the G. max reference sequence. Circles from outer to inner represent chromosome, large deletion and inversion, respectively. The figure was drawn using circular genome data visualization software, Circos (http://circos.ca/).

