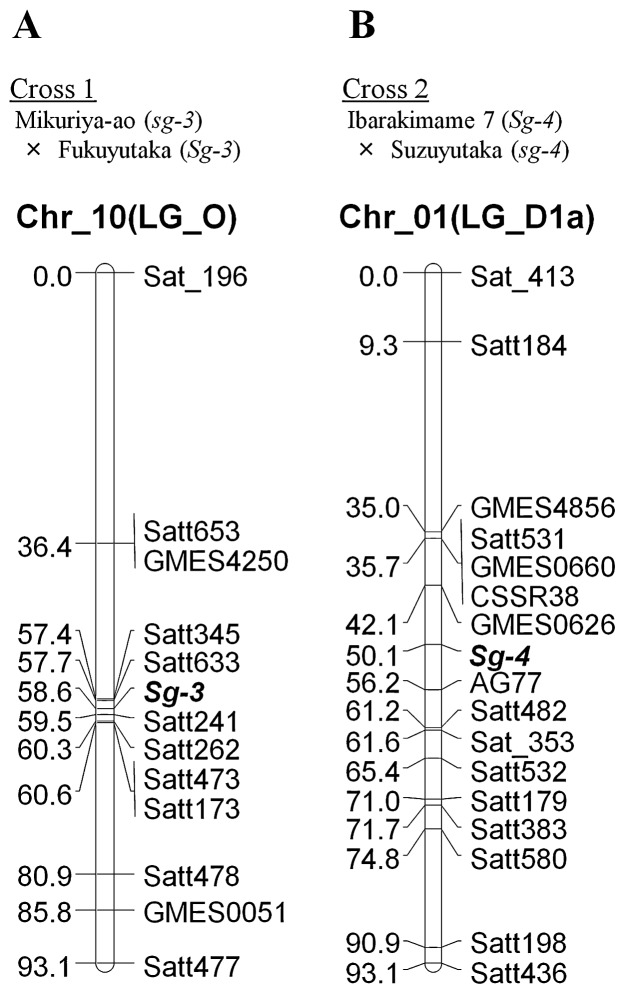
Fig. 3.
Genetic linkage maps of Sg-3 locus positioned in soybean chromosome 10 (linkage group O) and Sg-4 locus in soybean chromosome 1 (linkage group D1a) along with SSR markers. A. Cross 1: an F2 population derived from crosses between Mikuriya-ao (sg-3) and Fukuyutaka (Sg-3), B. Cross 2: a population of RILs in F9 generation derived from crosses between Ibarakimame 7 (Sg-4) and Suzuyutaka (sg-4). Genetic distance of SSR markers and Sg-3 and Sg-4 loci is shown in centimorgans (cM).

