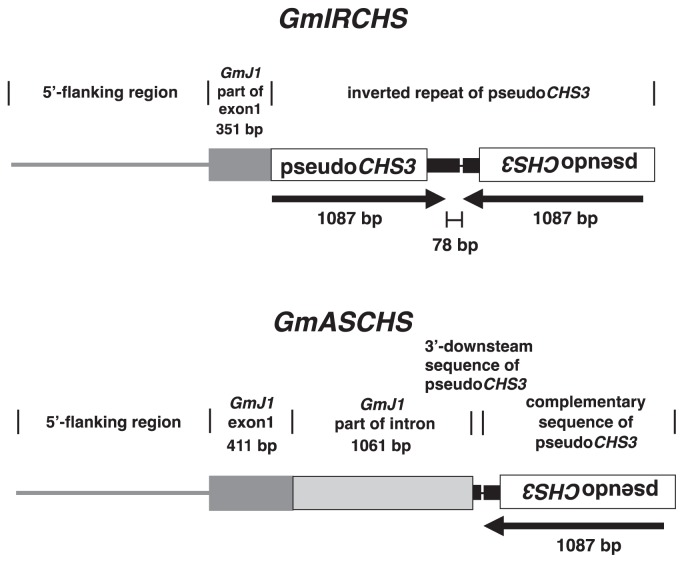
Fig. 2.
Schematic representation of the structure of GmIRCHS and GmASCHS. A 5′-flanking region, exon1 and intron of GmJ1 are represented by a gray line, gray box and stippled box, respectively. A pseudoCHS3 and its 3′-downstream region are indicated by an open box and a broad black line, respectively. The position and relative orientations of a pseudoCHS3 inverted repeat are indicated by black horizontal arrows. The 78 bp distance between a pseudoCHS3 (1087 bp) and its complementary sequence (1087 bp), which comprise the inverted repeat of pseudoCHS3, is indicated. The 16-bp unique sequence is denoted by a thin black line.

