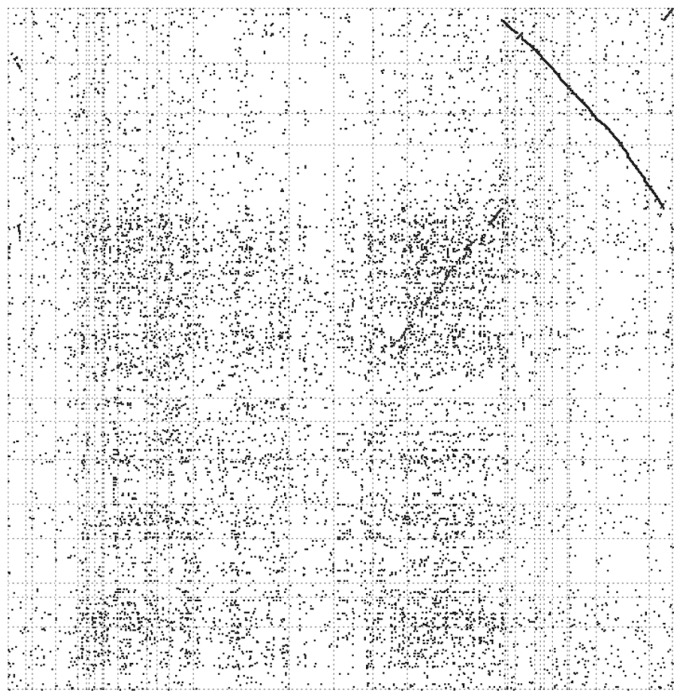
Fig. 2.
Close comparison of two soybean chromosomes. The soybean chromosome 10 assembly (Gm10, horizontal) and chromosome 20 assembly (Gm20, vertical) are shown. Each dot represents homology of predicted coding sequences in the two chromosomes. Faint dotted lines show the boundaries of smaller sequence assemblies that were ordered to produce the chromosome-scale assemblies. Diagonal features in the upper right quadrant indicate corresponding regions between these two chromosomes. A large inversion is indicated by a line of homology dots that slopes down and to the right. The interrupted diagonal toward the center has been disrupted by transposon insertions in pericentromeric regions in both chromosomes. The pericentromeric regions are also marked by higher densities of dots (homologies) in roughtly the lower-left two thirds of the space, primarily caused by retrotransposon sequences.

