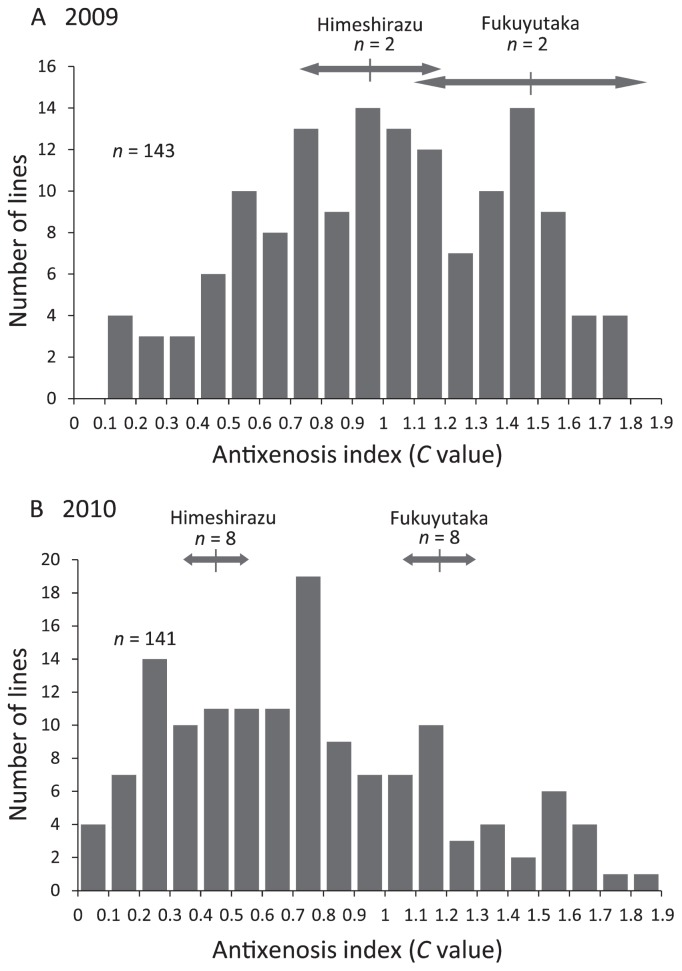
Fig. 2.
Frequency distribution of antixenosis resistance values in the RILs derived from the cross Fukuyutaka × Himeshirazu in (A) 2009 and (B) 2010. The antixenosis resistance was expressed using C values (calculated using equation 1), which represent the resistance relative to that of a standard variety, Akisengoku. Arrows indicate the positions of the mean values and ranges for the parent varieties.

