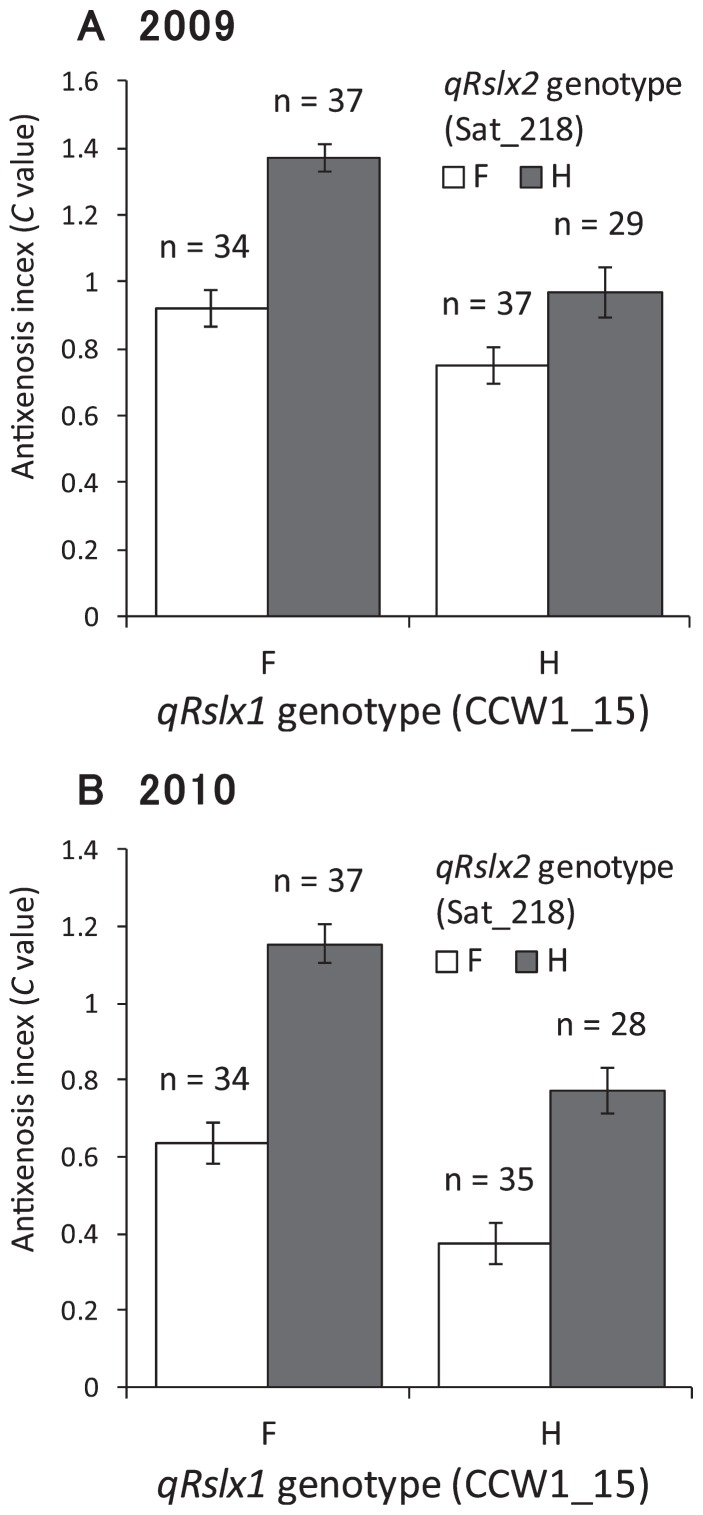
Fig. 4.
Differences in the mean antixenosis (C) values for four genotype combinations in (A) 2009 and (B) 2010. Each genotype is represented by the two nearest marker loci (CCW1_15 for qRslx1 and Sat_218 for qRslx2). F and H indicate homozygosity for the Fukuyutaka and Himeshirazu alleles, respectively. Values represent means ± standard errors.

