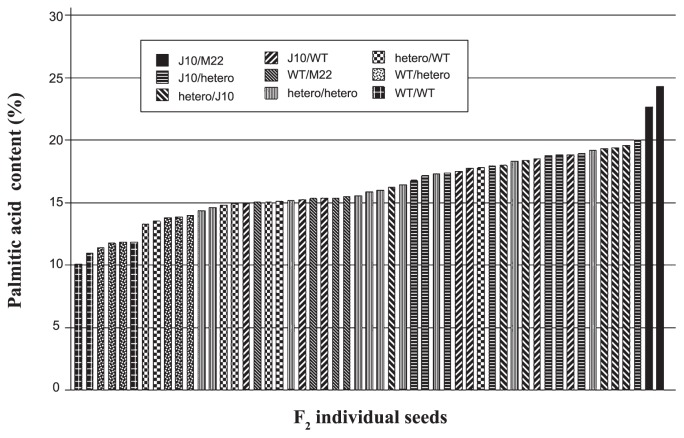
Fig. 5.
Comparison of palmitic acid content and marker segregation on F2 seed individuals obtained from the cross between J10 and M22. The palmitic acid contents are arranged in the order of increasing palmitic acid content. The patterns of individual bars indicate nine genotypes as illustrated in the figure.

