Fig. 1.
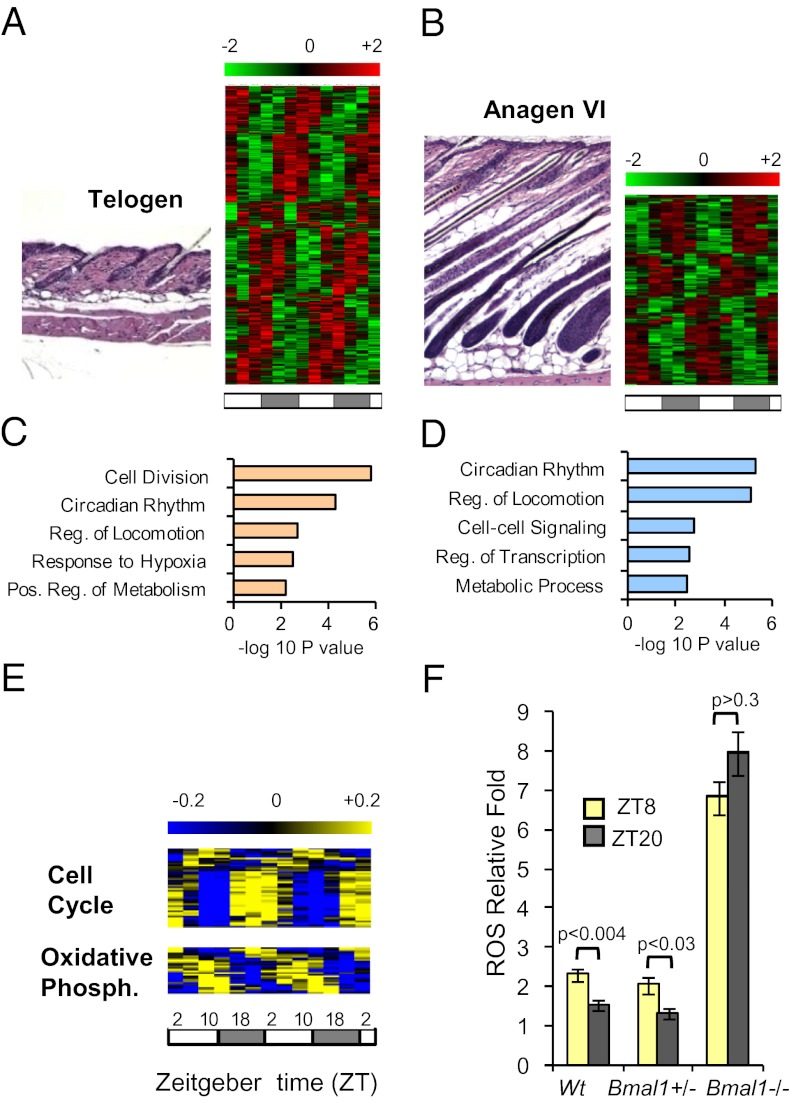
The circadian transcriptome of skin. (A and B) Representative histology and heatmaps of the circadian transcriptomes for (A) telogen and (B) anagen skin. (C and D) The five most significantly enriched functional categories among (C) telogen and (D) anagen circadian genes. (E) Heatmaps of telogen circadian genes encoding oxidative phosphorylation and cell-cycle regulators. (F) Quantification of ROS levels in telogen skin at ZT8 and ZT20 from WT, Bmal1+/−, and Bmal1−/− mice. P values were determined by Student’s t test. Two-way ANOVA revealed a significant effect of genotype [F(1,11) = 371.33; P < 0.0001]. Error bars represent SEM for three to seven biological replicates. The LD cycles are indicated below the time-course panels. Numbers above the color scales indicate log2-transformed mean-centered expression values.

