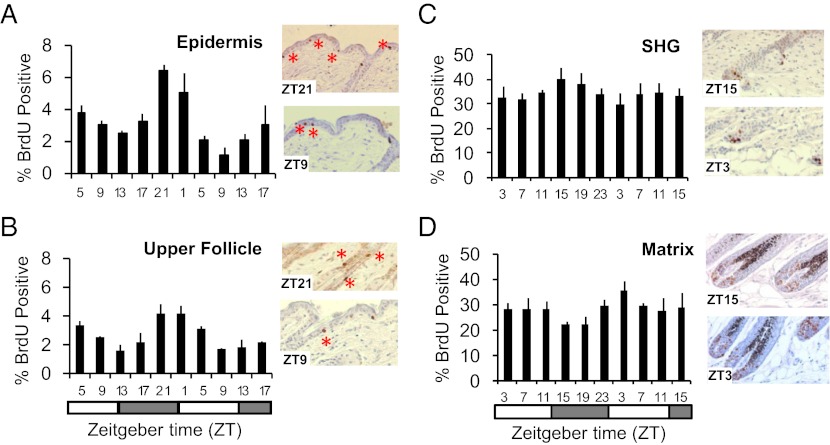
Fig. 2.
Circadian proliferation in the mouse epidermis. The data were analyzed by ANOVA and sinusoidal wave fitting. Percentage of BrdU-positive nuclei in (A) the telogen interfollicular epidermis [F(2,20) = 14.3; P = 6.8 × 10⁻⁷; sine-wave P = 7.6 × 10⁻⁴], (B) the telogen upper follicle [F(2,20) = 4.8; P = 0.0016; sine-wave P = 1 × 10⁻⁶], (C) the secondary hair germ (SHG) at P23 [F(2,20) = 0.73; P = 0.68; sine-wave P = 1.04 × 10⁻²], and (D) the matrix at P27 [F(2,20) = 0.68; P = 0.21; sine-wave P = 9.3 × 10⁻³]. Representative immunohistochemical images of each compartment are shown. The error bars represent SEM for three or four biological replicates. The LD cycles are indicated below the time-course panels.

