Fig. 2.
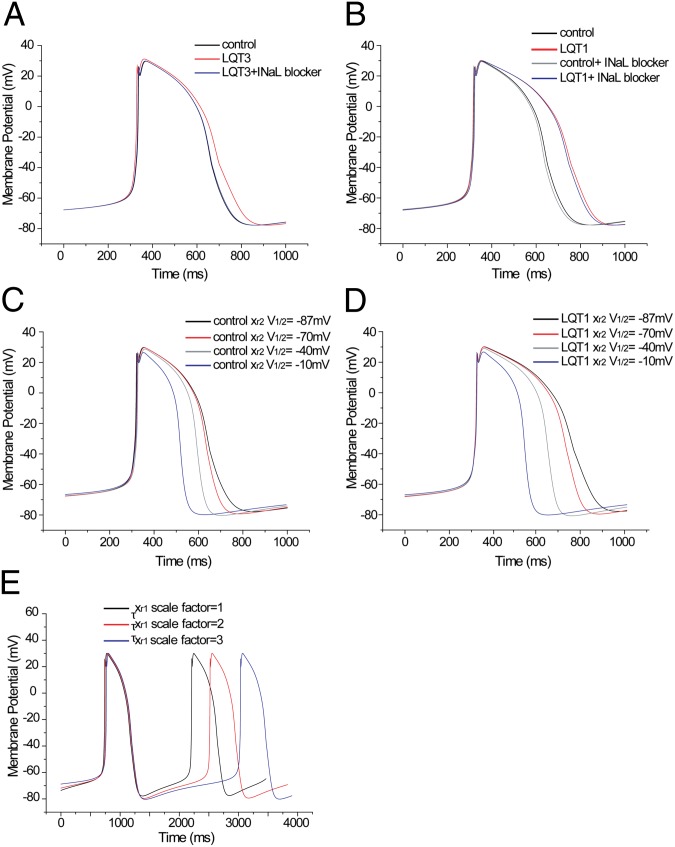
Simulation study of different compound effects on iPSC-derived cardiomyocytes from a healthy control and a patient with LQT1. (A) Simulated AP from a healthy control without compound treatment (INaL = 0.055 nS/pF) and a presumed patient with LQT3 without compound treatment (INaL = 0.33 nS/pF) or with INaL blocker treatment (INaL = 0.070 nS/pF). (B) Simulated action potential from a healthy control without compound treatment (INaL = 0.055 nS/pF, scale factor of GKs = 1), a patient with LQT1 without compound treatment (INaL = 0.055 nS/pF, scale factor of GKs = 0.3), a healthy control with INaL blocker treatment (INaL = 0.014 nS/pF, scale factor of GKs = 1), or a patient with LQT1 with INaL blocker treatment (INaL = 0.014 nS/pF, GKs =0.3). (C) Simulated APs from a healthy control (scale factor of GKs = 1, xr2 V1/2 = −87 mV) and a healthy control with a progressive shift in xr2 V1/2 = −70 mV, −40 mV, −10 mV, respectively, to show different doses of compound effect on inactivation V1/2. (D) Simulated APs from a patient with LQT1 without compound treatment (scale factor of GKs = 0.3, xr2 V1/2 = −87 mV) and a patient with LQT1 with progressive shift in xr2 V1/2 = −70 mV, −40 mV, or −10 mV, respectively. (E) Simulated AP from a patient with LQT1 without compound treatment (scale factor of txr1 = 1) and a patient with LQT1 with progressive decrease in IKr decay. Scale factor of txr1 = 2 or 3, respectively, to mimic different doses of compound effect on deactivation.

