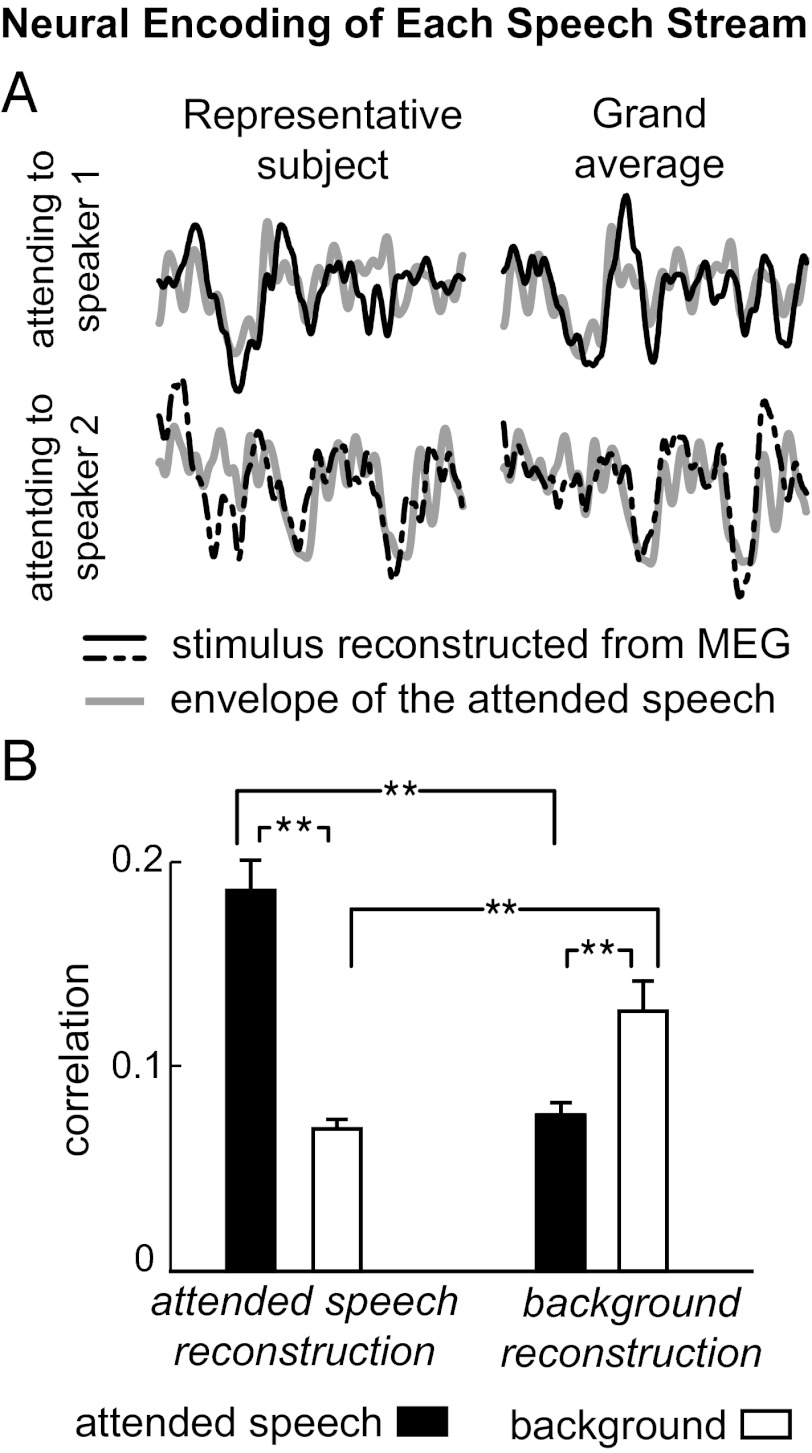
Fig. 2.
Decoding the cortical representation specific to each speech stream. (A) Examples of the envelope reconstructed from neural activity (black), superimposed on the actual envelope of the attended speech when presented in isolation (gray). (Upper and Lower) Different envelopes are decoded from neural responses to identical stimuli, depending on whether the listener attends to one or the other speaker in the speech mixture, with each resembling the envelope of the attended speech. Here, the signals, 5 s in duration, are averaged over three trials for illustrative purposes, but all results in the study are based on single-trial analysis. (B) Two separate decoders reconstruct the envelope of the attended and background speech, respectively, from their separate spatial-temporal neural responses to the speech mixture. The correlation between the decoded envelope and the actual envelope of each speech stream is shown in the bar graph (averaged over trials and speakers), with each error bar denoting 1 SEM across subjects (**P < 0.005, paired permutation test). The separate envelopes reconstructed by the two decoders selectively resemble that of attended and background speech, demonstrating a separate neural code for each speech stream.

