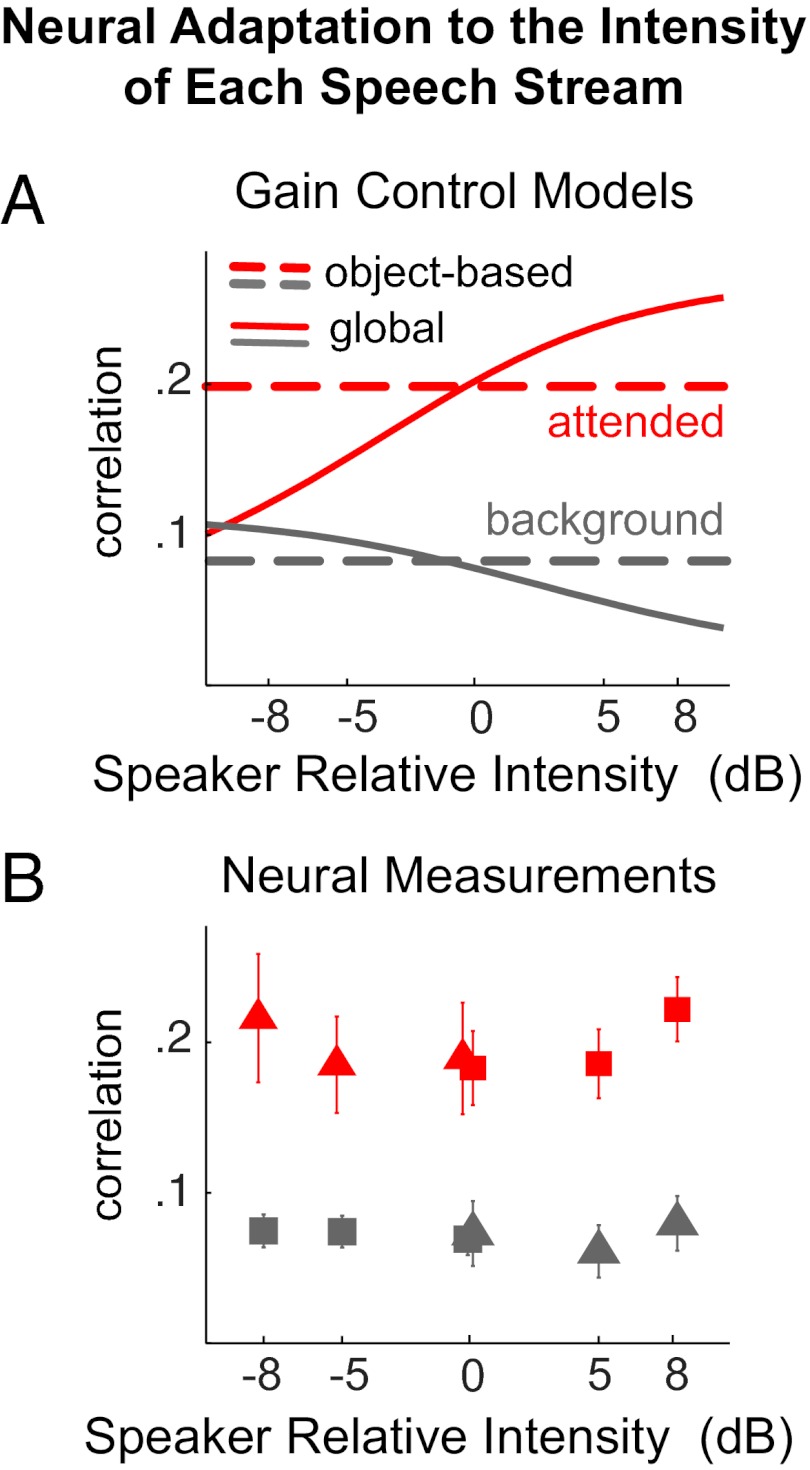
Fig. 3.
Decoding the attended speech over a wide range of relative intensity between speakers. (A) Decoding results simulated using different gain control models. The x axis shows the intensity of the attended speaker relative to the intensity of the background speaker. The red and gray curves show the simulated decoding results for the attended and background speakers, respectively. Object-based intensity gain control predicts a speaker intensity invariant neural representation, whereas the global gain control mechanism does not. (B) Neural decoding results in the Varying-Loudness experiment. The cortical representation of the target speaker (red symbols) is insensitive to the relative intensity of the target speaker. The acoustic envelope reconstructed from cortical activity is much more correlated with the attended speech (red symbols) than the background speech (gray symbols). Triangles and squares are results from the two speakers, respectively.

