Fig. 7.
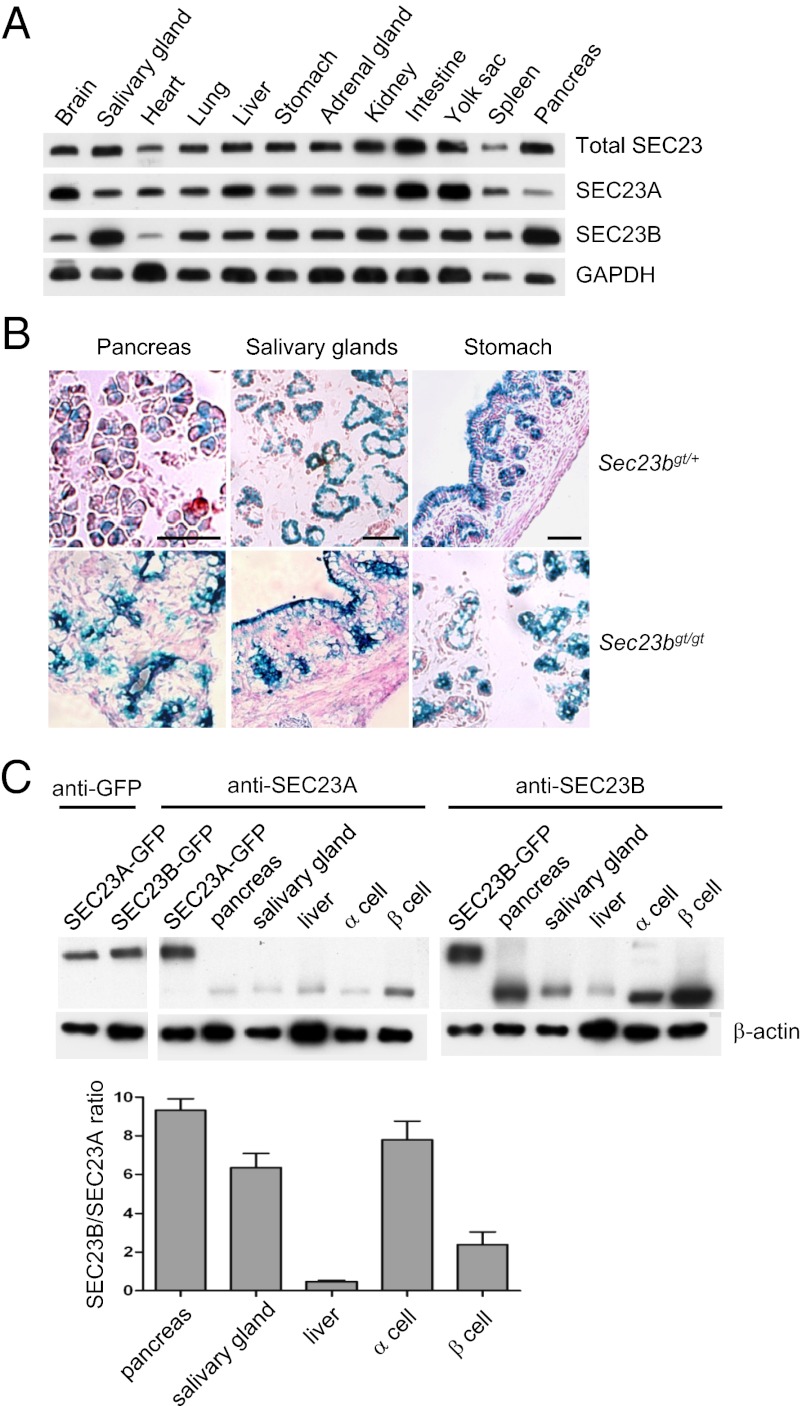
Relative abundance of SEC23A and SEC23B across tissues of WT mice. (A) Lysates were prepared from E18.5 embryos and analyzed by Western blotting. Total SEC23 was detected by an antibody that recognizes both paralogues, whereas SEC23A and SEC23B were detected by specific antibodies. GAPDH serves as a loading control. (B) β-Gal staining of Sec23bgt/+ and Sec23bgt/gt pancreas, salivary glands, and stomach from E18.5 embryos. For salivary glands, the lower left side of the image shows serous acini and the upper right side shows mucous acini. (Scale bar: 50 μm.) (C) Relative expression levels of SEC23A and SEC23B in the same tissues or cells. Levels of exogenously expressed GFP-SEC23A and GFP-SEC23B fusion proteins were first quantified by Western blot analysis by using an anti-GFP antibody (Left). Similar amounts of GFP-SEC23A and GFP-SEC23B proteins, along with lysates from E18.5 mouse embryonic pancreas, salivary gland, and liver, as well as lysates from α-TC1 β-TC-6 cells (American Type Culture Collection) were separated on single SDS/PAGE gels (Right). Western blot analysis was performed with antibodies specific for SEC23A or SEC23B. β-Actin was used as an internal control. The lower graph shows the quantitative comparison. Error bars represent mean ± SEM of results from three independent biological samples.

