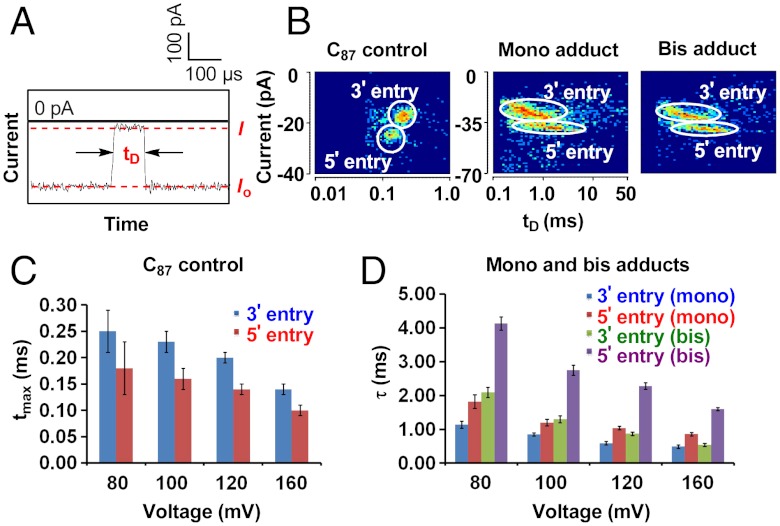
Fig. 3.
Translocation studies of AP-18c6 in homopolymeric strands with 3 M NaCl as the electrolyte. (A) Typical i -t trace of the control strand and definition of translocation duration (tD). (B) Sample density plots of control and adducted strands (120 mV trans vs. cis). (C) Plot of tmax vs. voltage for the control strand. (D) Plot of τ vs. voltage for the mono and bis adducts.

