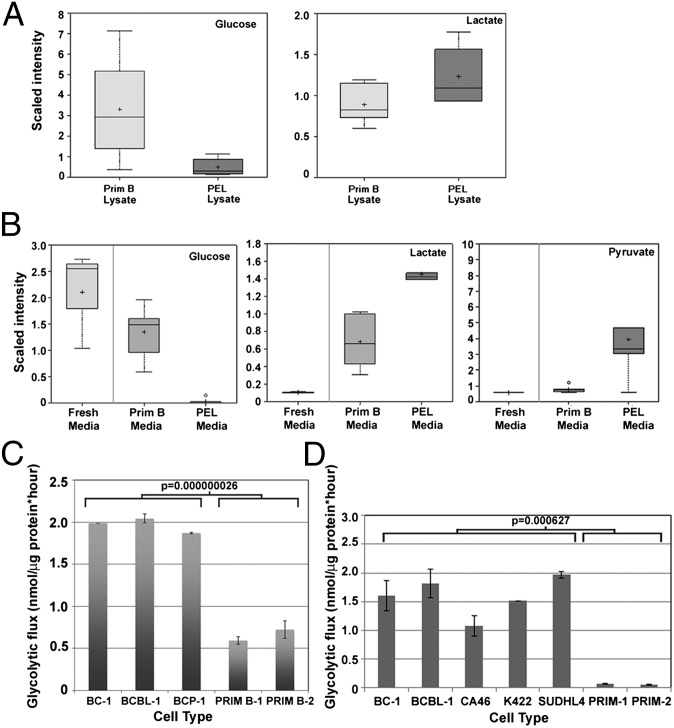
Fig. 2.
PEL up-regulate glycolysis. The protein-normalized relative intensities (“scaled intensities”) of intra- and extracellular concentrations of glycolytic intermediates, represented as box and whisker plots, are significantly different between PEL and primary B cells. Data are the combined average of six different primary B cells derived from six healthy donors and six PEL lines. (A) Intracellular levels of free Glc are lower, whereas that of lactate are higher in PEL, compared with primary B cells. (B) The spent media of PEL contains lower concentration of Glc and increased levels of lactate and pyruvate compared with the spent media of primary B cells. (C) Equal numbers of PEL and primary cells were cultured for 24 h, and glycolytic flux was measured. PEL cells exhibit significantly increased (P = 0.000000026) glycolysis compared with primary human B cells. (D) Equal numbers of PEL, BL (CA46), FL (K422 and SUDHL4), and primary B cells were cultured for 24 h, and glycolytic flux was measured. All B-NHL have significantly (P = 0.000627) higher glycolytic flux compared with primary B cells. Data are normalized to total input protein. Error bars are ± SEM; data are one representative of more than five independent experiments.

