Fig. 5.
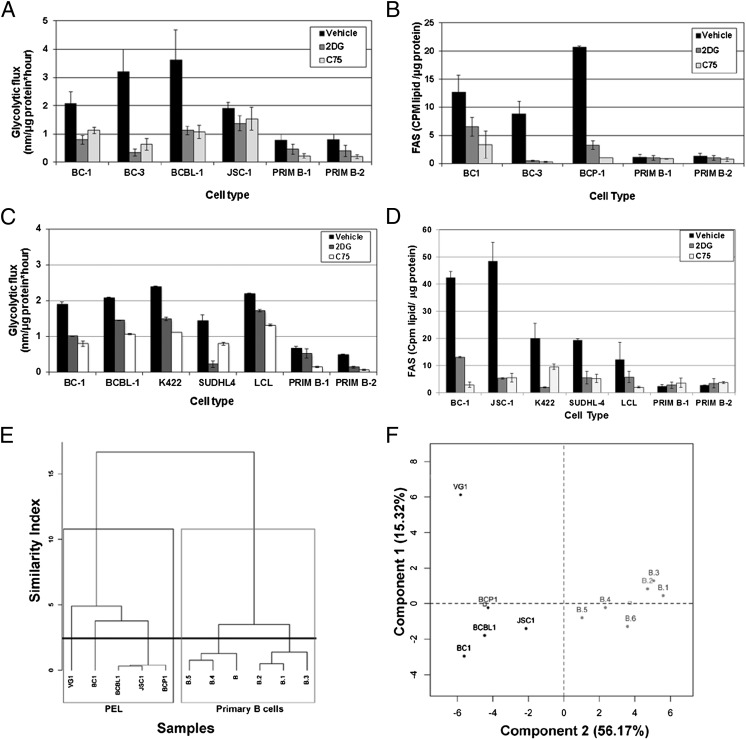
Glycolysis and FAS are intimately linked in B-NHL. (A) PEL and primary B cells treated for 72 h with 10 μg/mL C75 show a significant decrease in glycolysis (P ≤ 0.05 for all comparisons), similar to 1 mM 2DG-treated cells (positive control). Error bars are ± SEM. (B) PEL cells treated for 72 h with 1 mM 2DG have decreased FAS (P ≤ 0.05), and with 10 μg/mL C75 (positive control) have significantly decreased FAS (P ≤ 0.05). Primary B cells display minimal FAS activity, which is not down-regulated with inhibitors. Error bars are ± SEM; data are representative of more than three independent experiments. (C) B-NHL (including PEL), LCL, and primary B cells treated for 72 h with 10 μg/mL C75 show a reduction in glycolysis comparable with 2DG-treated cells. (D) Glycolysis inhibition of B-NHL (including PEL) and LCL with 2DG substantially reduces FAS to a rate similar to the FASN inhibitor C75, but does not impact FAS in primary B cells. (E and F) A dendrogram of hierarchical clustering (E) and principal component analysis (F) of relative intensities of metabolic intermediates of glycolysis and FAS demonstrates that PEL and primary B cells display distinct metabolic profiles.

