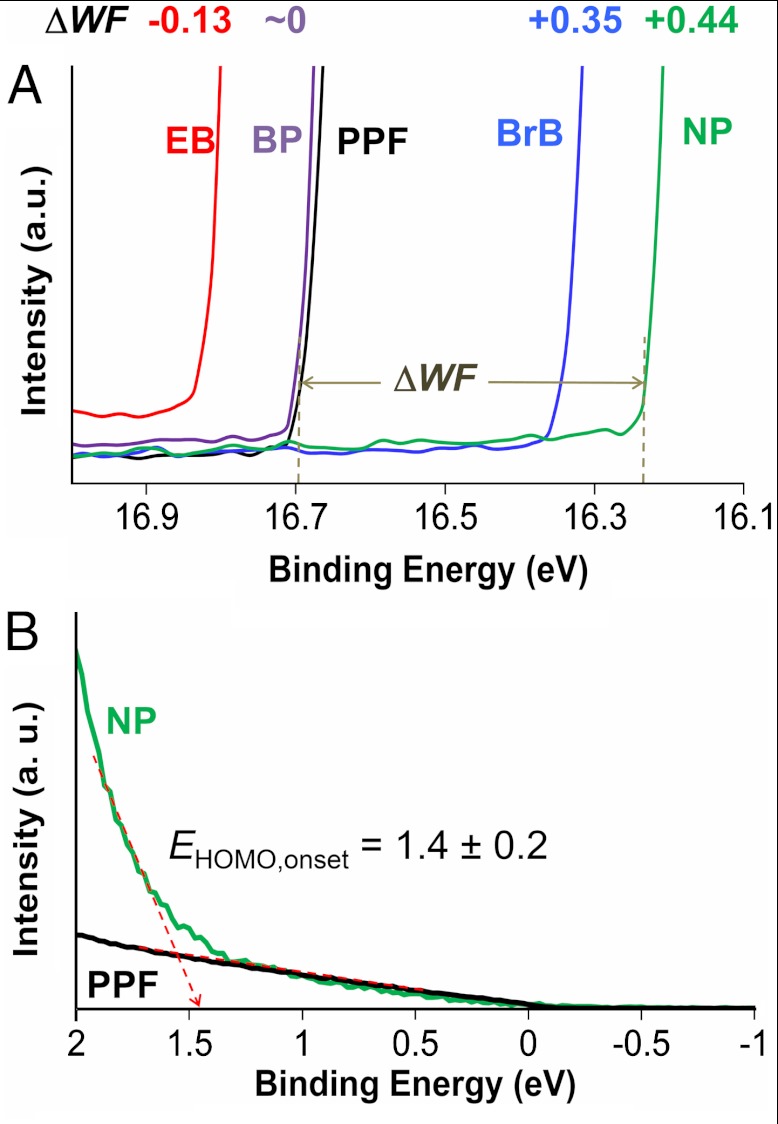
Fig. 5.
(A) Close-up of the HBEC region for unmodified PPF and four samples modified with different molecular structures, showing that electron-withdrawing groups shift the WF positive, while a donating group shifts it negative. A detailed energy level diagram is given in SI Appendix (Section 4). (B) Example for determination of EHOMO,onset using the method of Kim et al. (4). See SI Appendix (Section 3) for data for other molecules.

