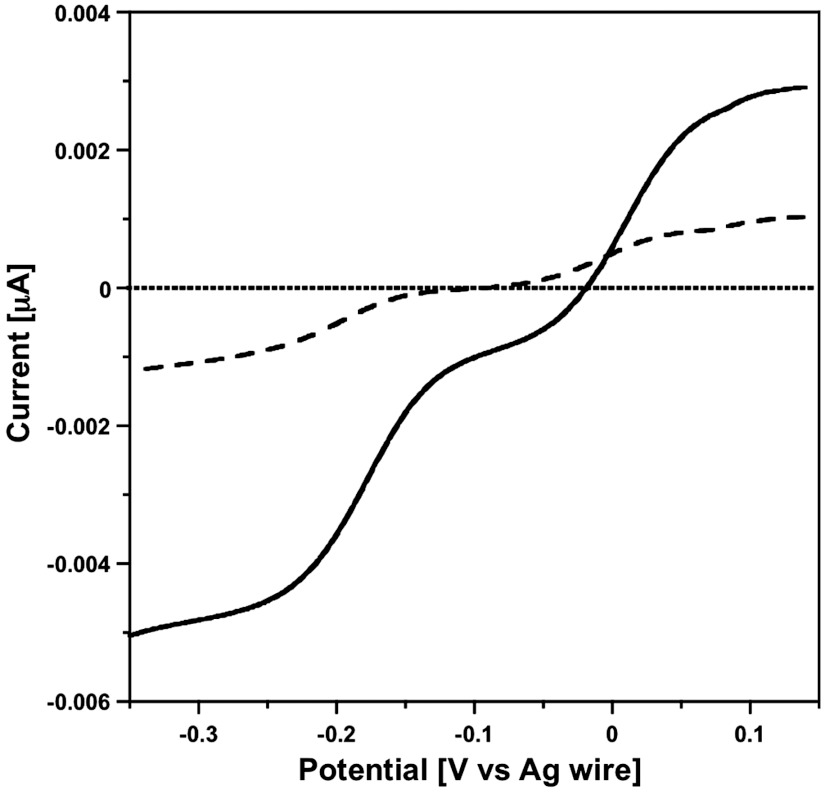
Fig. 4.
Steady-state voltammograms (GC microelectrode; d = 15 μm); ν = 0.002 V s-1) obtained in the aqueous phase (K6[P2W18O62], 0.3 mM; KCl, 0.1 M) after 20 min of irradiation of the water–DEAS two-phase system. Voltammograms obtained just above the interface (‐‐‐) and in the bulk region (---) of the aqueous solution phase.

