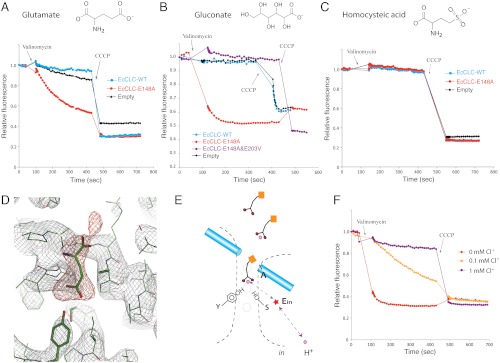
Fig. 4.
Isolation of the H+ partial reaction. (A) Flux assays (K+ gradient driven) in which 300 mM Cl- was completely replaced by glutamate. Fluorescence changes of E148A mutant (red) were compared to WT (blue) EcCLC and empty vesicles (black). (B) Fluorescence changes of E148A mutant (red), E148A&E203V double mutant (purple), WT (blue) EcCLC, and empty vesicles (black). The solutions contained only gluconate and no Cl-. (C) Fluorescence changes of E148A mutant (red), WT (blue) EcCLC, and empty vesicles (black) in the presence of homocysteic acid as the anion. (D) Electron density map around the ion transport region of E148A mutant EcCLC. The protein was crystallized in the absence of Cl- but with glutamate in the solution. The weighted 2fo-fc map contoured at 1.8σ is shown as a gray mesh and the fo-fc map contoured at 3.5σ is displayed as a red mesh. A glutamate molecule (shown as sticks) was manually placed into the density. (E) Working model for H+ transport mediated by solution molecules. Carboxylate-containing molecules in the solution are shown as schematic drawings. Purple spheres represent H+, and the red star denotes the internal glutamate. Dashed lines with arrows indicate a possible H+ transfer route. (F) Competition between Cl- and carboxylate in the anion transport pathway. Fluorescence changes of E148A mutant EcCLC in the presence of 450 mM gluconate were measured with addition of different concentrations of chloride (0 mM Cl- in red, 0.1 mM Cl- in yellow, and 1 mM Cl- in purple).

