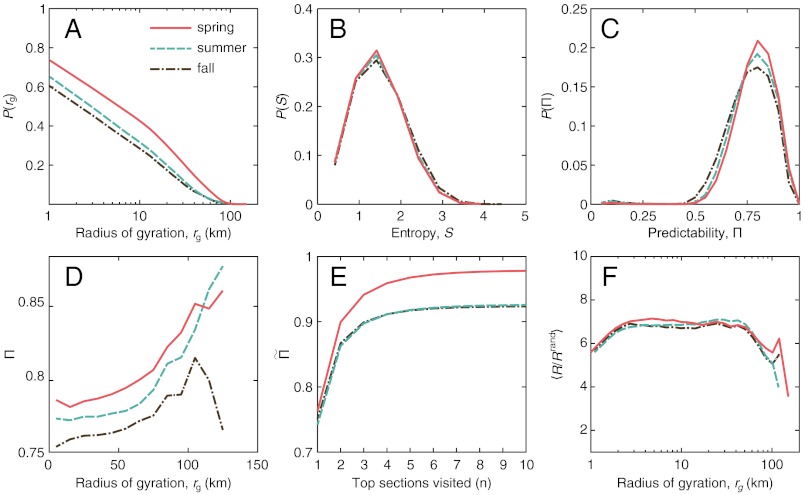
Fig. 2.
Trajectory analysis of mobile phone users who were present in PaP on the day of the earthquake. (A) Shows the cumulative distribution of the radius of gyration: rg. (B) Displays the distribution of entropy S. (C) Gives the distribution of the maximal predictability Π. (D) Shows the correlation between radius of gyration rg and Π. In (E), we graph the fraction of time a person spent in the top n visited communes  . (F) gives the averaged R/Rrand versus the radius of gyration rg, showing a relative stable dependence.

