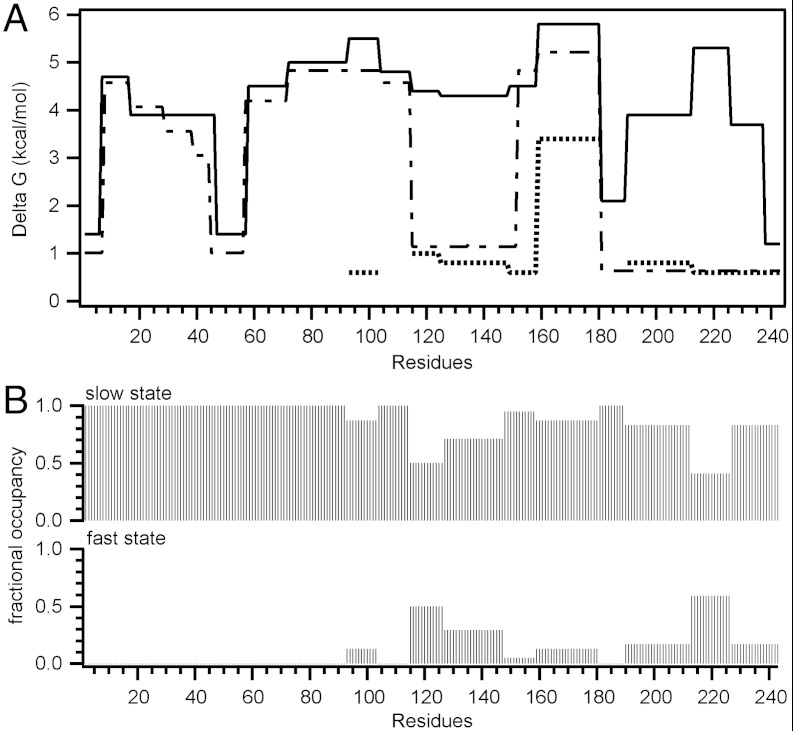
Fig. 3.
HX kinetics (pD 7.3, 5 °C) for lipid-bound apoA-I in 7.8 nm POPC/apoA-I discoidal HDL particles. (A) Each segment of the plot of helix stabilization free energy against apoA-I sequence position corresponds to peptides shown in Fig. S9. For peptides exhibiting bimodal HX kinetics, ΔG for the fast and slow states are represented by the dotted and solid lines, respectively. The dashed line shows ΔG for lipid-free apoA-I. (B) Fractional occupancies for peptides exhibiting bimodal HX kinetics, calculated from 30 s HX data (cf. Fig. S8) of the fast and slow states.

