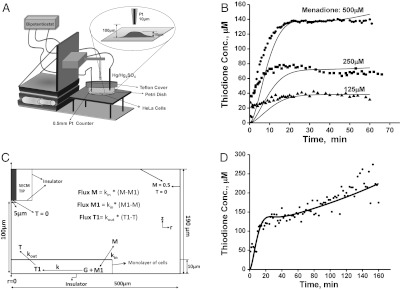
Fig. 2.
(A) Schematic diagram of SECM set up for direct electrochemical detection of thiodione efflux from a monolayer of living HeLa cells. (B) The thiodione concentration with time (min) when cells were exposed to 500 µM (solid circle), 250 µM (solid square), and 125 µM (solid triangle) concentrations of menadione. The solid line represents the fitting of simulated curve with experimental data (points expressed in various symbols). Simulation parameters: kin: 1.6 × 10⁻⁸ m/s; kout: 1.6 × 10⁻⁷ m/s. (C) Schematic diagram of the simulation model to determine the kinetics of menadione (M) permeating through the cell membrane and thiodione (T) efflux by MDR pumps. M1: menadione inside cell; G: glutathione; T1: thiodione inside cell. The concentration of bulk solution was 0.5 mM for 500 µM menadione solution experiment. (D) Thiodione response to 500 µM menadione added to HeLa cells for 160 min (solid circle points). Solid line represents the simulated curve.

