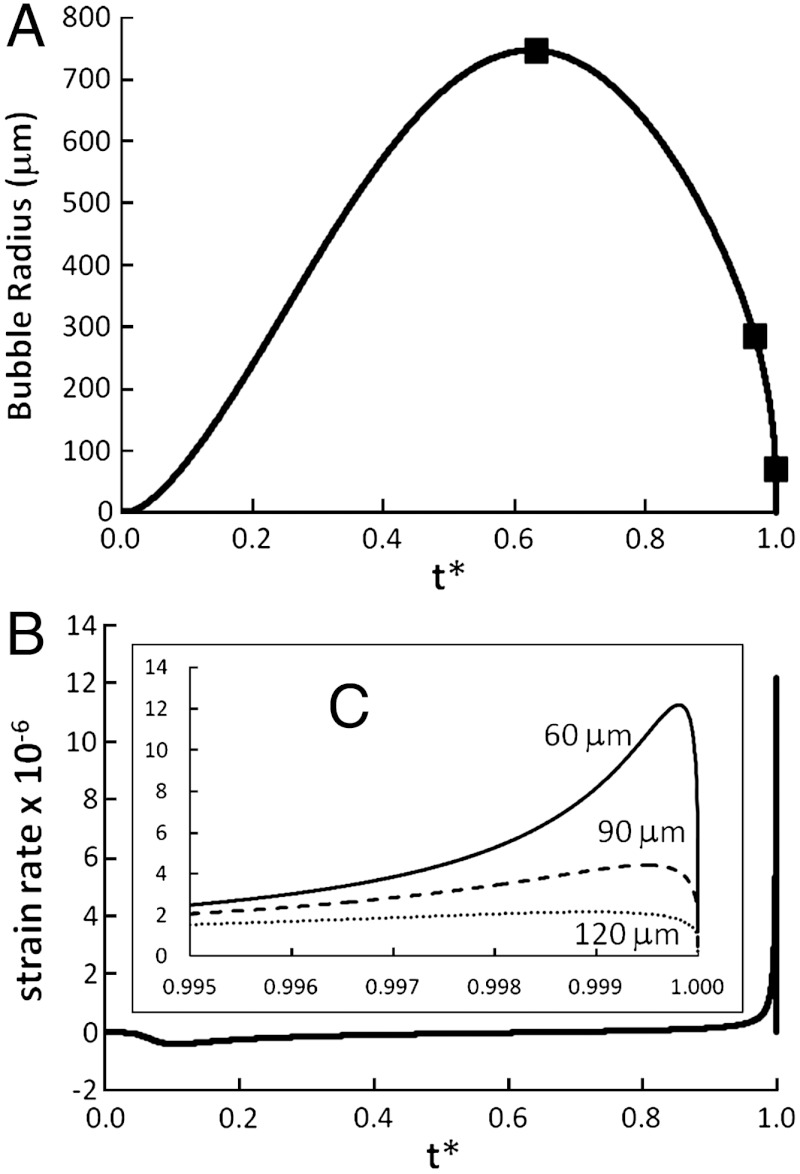
Fig. 3.
(A) Bubble radius vs. dimensionless time t∗ for PA0 = 1500 kPa. The snapshots in Fig. 4 are marked. (B) Dimensionless strain rate ( ) at the CNT CoM as a function of t∗ (PA0 = 5000 kPa, L = 1.5 μm, Lp = 20 μm, N = 33, di = 60 μm) and (C) near the end of collapse for varying di.

