Figure 1.
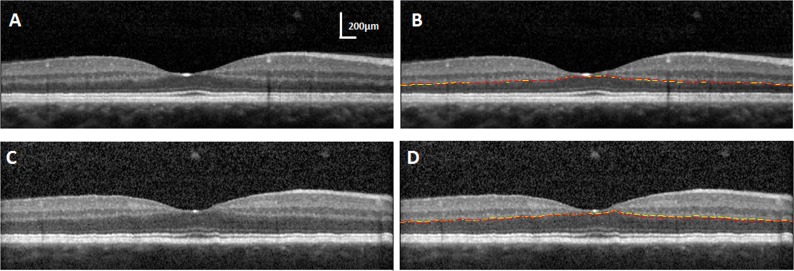
(A) A horizontal SDOCT image without segmentation lines for a young subject. (B) SDOCT segmentation for the ONL/OPL, showing the best reproducibility of manual segmentation 6 months apart. SD = 0.3 pixels for the same SDOCT image in (A). (C) A horizontal SDOCT image without segmentation lines for another young subject. (D) SDOCT segmentation for the ONL/OPL, showing the worst reproducibility of manual segmentation. SD = 2 pixels for the same SDOCT image in (C). First segmentation, yellow lines; second segmentation, red lines.

