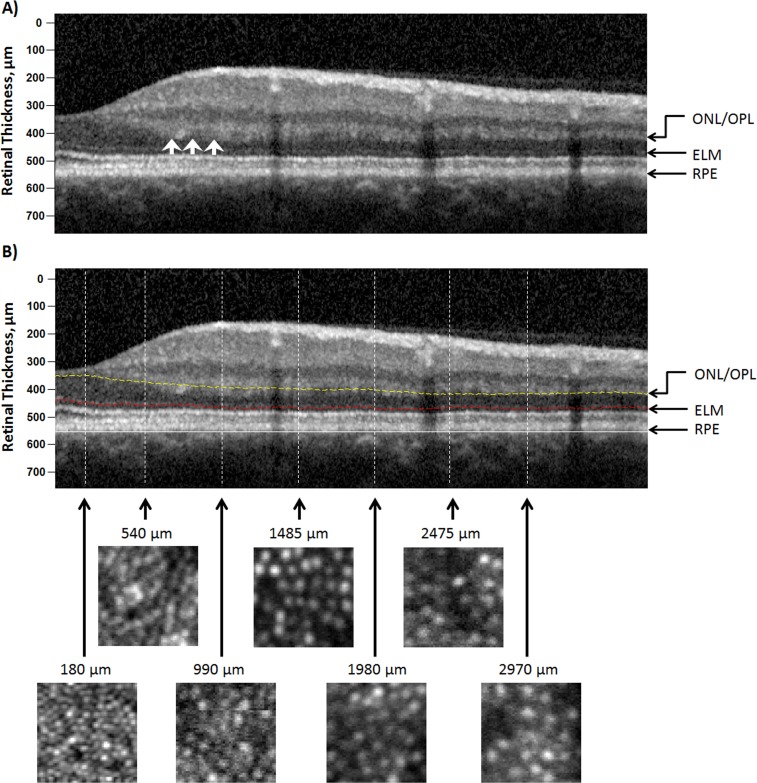
Figure 2.
(A) SDOCT image, a vertical scan along the superior retina of the same subject in Figures 1A and 1B, without segmentation lines. (B) SDOCT (top) and AOSLO (bottom) images along the superior retina. On the SDOCT image, the distance between the ONL/OPL and ELM was taken as the ONL+ HFL thickness. The white arrows indicate the hyperreflectivity of HFL. The lower panel shows a series of cone photoreceptor images with a sampling window of 50 × 50 μm at the corresponding retinal eccentricities along the SDOCT scan. ONL/OPL (dashed yellow line); ELM (dashed red line); posterior boundary of the RPE (white line).

